Waterfall Chart
- 8 minutes to read
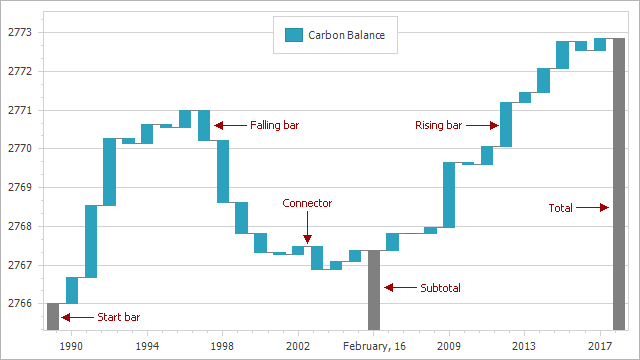
A Waterfall chart (also called Bridge Chart, Cascade Chart or Flying Bricks Chart) displays a sequence of bars that indicate positive or negative changes. You can plot Waterfall charts based on relative or absolute data values, and add two types of summary bars. The Total bar summarizes all values and is on the right side of the chart’s diagram. Subtotals can be defined between two adjacent points (bars) to display intermediate values.

Demo: Waterfall
Chart Type Characteristics
The table below lists the main waterfall chart characteristics:
| Feature | Value |
|---|---|
| Series view type | WaterfallSeriesView |
| Diagram type | 2D XYDiagram |
| Number of arguments per series point | 1 |
| Number of values per series point | 1 |
The following image shows the waterfall chart elements:
Create a Waterfall Chart
The following example creates a WebChartControl with a series of the WaterfallSeriesView type:
- Add a chart to the Web Forms project and specify the chart’s data source.
- Add a series to the chart. Set its view type to Waterfall.
- Specify data members for the series.
public partial class WebForm1 : System.Web.UI.Page {
    protected void Page_Load(object sender, EventArgs e) {
        WebChartControl WebChartControl1 = new WebChartControl();
        WebChartControl1.Width = 1000;
        WebChartControl1.Height = 600;
        Series series = new Series("Carbon Balance", ViewType.Waterfall);
        series.FilterCriteria = new BinaryOperator("Factor", "Imbalance", BinaryOperatorType.Equal);
        series.SetDataMembers("Year", "Contribution");
        WebChartControl1.Series.Add(series);
        WebChartControl1.DataSource = LoadDataTableFromXml("carbon.xml", "CarbonContribution");
        WebChartControl1.DataBind();
        this.form1.Controls.Add(WebChartControl1);
    }
    public static DataTable LoadDataTableFromXml(string fileName, string tableName) {
        DataSet xmlDataSet = new DataSet();
        using (Stream xmlStream = File.OpenRead(HttpContext.Current.Server.MapPath("~/App_Data/" + fileName))) {
            xmlDataSet.ReadXml(xmlStream);
            xmlStream.Close();
        }
        return xmlDataSet.Tables[tableName];
    }
}
The data structure appears as follows:
<?xml version="1.0"?>
<ArrayOfCarbonContribution xmlns:xsi="http://www.w3.org/2001/XMLSchema-instance"
                           xmlns:xsd="http://www.w3.org/2001/XMLSchema">
  <xs:schema xmlns:xs="http://www.w3.org/2001/XMLSchema">
    <xs:element name="CarbonContribution">
      <xs:complexType>
        <xs:sequence>
          <xs:element name="Year" type="xs:int"/>
          <xs:element name="Factor" type="xs:string"/>
          <xs:element name="Contribution" type="xs:double"/>
        </xs:sequence>
      </xs:complexType>
    </xs:element>
  </xs:schema>
  <CarbonContribution>
    <Year>1990</Year>
    <Factor>Imbalance</Factor>
    <Contribution>0.69</Contribution>
  </CarbonContribution>
  <!--...-->
</ArrayOfCarbonContribution>
For more information on how to populate a chart with data, refer to the following help topic: Providing Data.
Process Relative and Absolute Data Values
If the WaterfallSeriesView.ValueOptions property is set to a WaterfallRelativeValueOptions object, the control processes data source values as increments/decrements. You can create and assign a WaterfallAbsoluteValueOptions object to treat data as absolute values.
The following charts visualize the same data but use different value options:
| Relative Value Options | Absolute Value Options |
|---|---|
 |
 |
The following table demonstrates data source values:
| Argument | Value |
|---|---|
| November | 20 |
| December | 10 |
| January | -5 |
| February | 10 |
| March | -10 |
Plot a Waterfall Based on Relative Values
Set the WaterfallSeriesView.ValueOptions property to a WaterfallRelativeValueOptions object if the chart data source stores increments/decrements. You can also display a start bar with the initial value before the measurement starts. The chart plots a start bar at zero if the start bar value is not specified.
private void Page_Load(object sender, EventArgs e) {
    // This example uses the series added in the previous section.
    series.ArgumentScaleType = ScaleType.Qualitative;
    WaterfallSeriesView view = series.View as WaterfallSeriesView;
    if (view != null) {
        WaterfallRelativeValueOptions valueOptions = new WaterfallRelativeValueOptions();
        valueOptions.StartBarLabel = "1989";
        valueOptions.StartBarValue = 2766D;
        valueOptions.ShowTotal = true;
        view.ValueOptions = valueOptions;
    }
}
Related API members
- WaterfallSeriesView.ValueOptions - Gets or sets settings specific to the relative or absolute data source values.
- WaterfallRelativeValueOptions - Stores settings for a waterfall chart that displays relative data values.
- WaterfallRelativeValueOptions.StartBarValue - Gets or sets the start bar value.
- WaterfallRelativeValueOptions.StartBarLabel - Gets or sets the start bar label.
Plot a Waterfall Based on Absolute Values
Set the WaterfallSeriesView.ValueOptions property to a WaterfallAbsoluteValueOptions object if the chart data source stores a set of absolute values. In this case, the chart automatically calculates differences and plots them as waterfall bars.
private void Page_Load(object sender, EventArgs e) {
    // This example uses the series added in the previous section.
    WaterfallSeriesView view = series.View as WaterfallSeriesView;
    if (view != null) {
        WaterfallAbsoluteValueOptions valueOptions = new WaterfallAbsoluteValueOptions();
        valueOptions.ShowTotal = true;
        view.ValueOptions = valueOptions;
    }
}
Related API members
- WaterfallSeriesView.ValueOptions - Gets or sets settings specific to the relative or absolute data source values.
- WaterfallAbsoluteValueOptions - Stores settings for a waterfall chart that displays absolute data values.
Add Total and Subtotals
The Waterfall Chart can display a total bar and multiple subtotals.
Note
You can only show the total bar and add subtotals to a series with qualitative arguments.
private void Page_Load(object sender, EventArgs e) {
    series.ArgumentScaleType = ScaleType.Qualitative;
    WaterfallSeriesView view = series.View as WaterfallSeriesView;
    if (view != null) {
        WaterfallRelativeValueOptions valueOptions = view.ValueOptions as WaterfallRelativeValueOptions;
        if (valueOptions != null) {
            valueOptions.ShowTotal = true;
            valueOptions.TotalLabel = "2018";
            valueOptions.Subtotals.Add(new Subtotal { PointIndex = 16, Label = "February 16, 2005" });
        }
    }
}
Related API Members:
- WaterfallValueOptionsBase.ShowTotal - Gets or sets whether to show the total bar.
- WaterfallValueOptionsBase.TotalLabel - Gets or sets the waterfall total bar’s string label that is used in the axis label and crosshair.
- WaterfallValueOptionsBase.Subtotals - Returns a collection of waterfall chart subtotals.
- Subtotal - A waterfall subtotal.
- Subtotal.PointIndex - Gets or sets an index of a waterfall point, after which a subtotal should be inserted.
- Subtotal.Label - Gets or sets the subtotal label.
Customize Waterfall Appearance
You can change the color of rising bars, falling bars, the total, subtotals, connectors, and the start bar. The Chart Control also allows you to customize the line style of connectors.
private void Page_Load(object sender, EventArgs e) {
    WaterfallSeriesView view = series.View as WaterfallSeriesView;
    if (view != null) {
        view.RisingBarColor = Color.FromArgb(218, 88, 89);
        view.FallingBarColor = Color.FromArgb(146, 206, 181);
        view.SubtotalBarColor = Color.Gray;
        view.TotalBarColor = Color.DarkGray;
        view.StartBarColor = Color.LightGray;
        view.ConnectorColor = Color.Black;
        view.ConnectorStyle.Thickness = 1;
    }
}
Related API Members:
- WaterfallSeriesView.RisingBarColor - Gets or sets the rising bar color.
- WaterfallSeriesView.FallingBarColor - Gets or sets the falling bar color.
- WaterfallSeriesView.SubtotalBarColor - Gets or sets the subtotal bar color.
- WaterfallSeriesView.TotalBarColor - Gets or sets the total bar color.
- WaterfallSeriesView.StartBarColor - Gets or sets the start bar color.
- WaterfallSeriesView.ConnectorColor - Gets or sets the connector color.
- WaterfallSeriesView.ConnectorStyle - Gets or sets the connector style settings.
Format the Crosshair Label and Series Labels
To format waterfall-related text in the crosshair label and series labels, use the SeriesBase.CrosshairLabelPattern and SeriesLabelBase.TextPattern properties. The Chart Control provides a {VABS} placeholder that displays an absolute point value. The {V} placeholder shows value changes for rising and falling bars, and the absolute value for the Total bar.

series.CrosshairLabelPattern = "Value: {VABS:f1}" + Environment.NewLine + "Change: {V}";
series.LabelsVisibility = DevExpress.Utils.DefaultBoolean.True;
series.Label.TextPattern = "{V}";
Specify Series Label Position
To specify waterfall series label position, use the WaterfallSeriesLabel.Position property. The DevExpress.XtraCharts.WaterfallSeriesLabelPosition enumeration lists the available values.

series.LabelsVisibility = DevExpress.Utils.DefaultBoolean.True;
((WaterfallSeriesLabel)series.Label).Position = WaterfallSeriesLabelPosition.InsideEnd;
Create a Chart with Multiple Waterfall Series
You can create a waterfall chart with multiple series. In this instance, the chart displays points of different series as stacked bars:
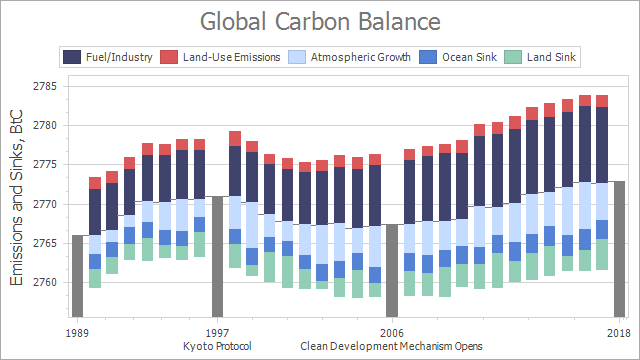
To create a chart with multiple series, use a series template to generate series or add series.
private void Page_Load(object sender, EventArgs e) {
    WebChartControl1.DataSource = LoadDataTableFromXml("../../Data/carbon.xml", "CarbonContribution");
    WebChartControl1.SeriesTemplate.ArgumentDataMember = "Year";
    WebChartControl1.SeriesTemplate.ValueDataMembers.AddRange(new string[] { "Contribution" });
    WebChartControl1.SeriesTemplate.SeriesDataMember = "Factor";
    WebChartControl1.SeriesTemplate.ArgumentScaleType = ScaleType.Qualitative;
    WebChartControl1.SeriesTemplate.View = new WaterfallSeriesView();
    WebChartControl1.DataBind();
}
Note
The following properties are synchronized in all waterfall series in the Chart Control. If you change these property values for any waterfall series, the Chart Control applies the same value to all other waterfall series.
- WaterfallSeriesView.ConnectorStyle
- WaterfallSeriesView.ConnectorColor
- WaterfallSeriesView.SubtotalBarColor
- WaterfallSeriesView.TotalBarColor
- WaterfallSeriesView.StartBarColor
- WaterfallSeriesView.ValueOptions
When you set a property before a Series is added to a chart’s collection, an ArgumentException is thrown.