Scatter Line Chart
- 3 minutes to read
Short Description
The Scatter Line Chart is represented by the ScatterLineSeriesView object, which belongs to Point, Line and Spline Series Views. This view displays series points in the order in which they appear in the collection. In contrast, other view types sort their points by arguments, and some aggregate points with equal arguments into a single entry along the X-axis. For example, the Line Chart is similar in most aspects to the Scatter Line Chart, but it sorts series points by arguments. The Scatter Line Chart is also similar to the Point Chart, with points connected by lines.
For example, the following image shows a Scatter Line Chart that displays a graph for the Archimedian spiral.
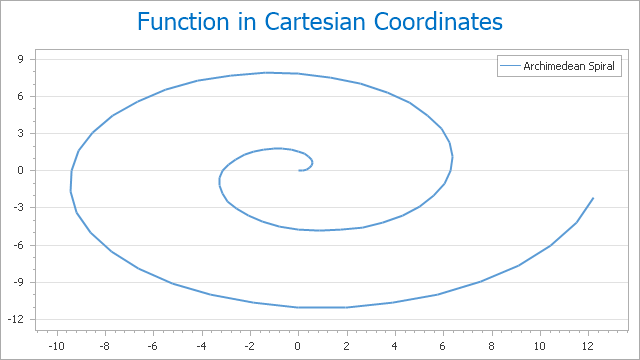
Chart Type Characteristics
The table below lists the main characteristics of this chart type.
| Feature | Value |
|---|---|
| Series View type | ScatterLineSeriesView |
| Diagram type | 2D-XYDiagram |
| Number of arguments per series point | 1 |
| Number of values per series point | 1 |
Note
For information on which chart types can be combined with the Scatter Line Chart, refer to the following help topic: Combining Different Series Views.
Example
The following example creates a ChartControl with a series of the ScatterLineSeriesView type, and adds this chart to a form at runtime. Note that for this specific scale type only, series points are not usually sorted by their arguments, but are instead displayed in the order in which they are added to the collection.
Before proceeding with this example, first create a Windows Forms Application in Visual Studio, and add all required assemblies to the project’s References list. Then, add the following code to the Form.Load event handler.
using DevExpress.XtraCharts;
// ...

private void Form1_Load(object sender, EventArgs e) {
    // Create a new chart.
    ChartControl scatterLineChart = new ChartControl();

    // Create a scatter line series.
    Series series1 = new Series("Series 1", ViewType.ScatterLine);

    // Add points to it.
    series1.Points.Add(new SeriesPoint(1, 2));
    series1.Points.Add(new SeriesPoint(2, 10));
    series1.Points.Add(new SeriesPoint(3, 4));
    series1.Points.Add(new SeriesPoint(4, 12));
    series1.Points.Add(new SeriesPoint(1.5, 17));
    series1.Points.Add(new SeriesPoint(2.5, 3));
    series1.Points.Add(new SeriesPoint(3.5, 14));
    series1.Points.Add(new SeriesPoint(2, 6));

    // Add the series to the chart.
    scatterLineChart.Series.Add(series1);

    // Set the numerical argument scale types for the series,
    // as it is qualitative, by default.
    series1.ArgumentScaleType = ScaleType.Numerical;

    // Access the view-type-specific options of the series.
    ((ScatterLineSeriesView)series1.View).LineStyle.DashStyle = DashStyle.Dash;

    // Access the type-specific options of the diagram.
    ((XYDiagram)scatterLineChart.Diagram).EnableAxisXZooming = true;

    // Hide the legend (if necessary).
    scatterLineChart.Legend.Visible = false;

    // Add a title to the chart (if necessary).
    scatterLineChart.Titles.Add(new ChartTitle());
    scatterLineChart.Titles[0].Text = "A Scatter Line Chart";

    // Add the chart to the form.
    scatterLineChart.Dock = DockStyle.Fill;
    this.Controls.Add(scatterLineChart);
}