Overlapped Gantt Chart
- 5 minutes to read
Short Description
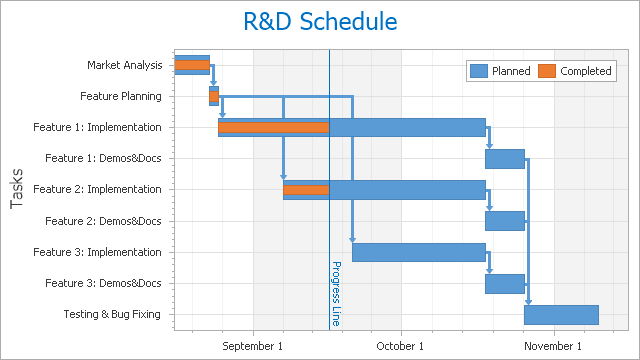
The Overlapped Gantt Chart is represented by the OverlappedGanttSeriesView object, which belongs to Gantt Series Views (also called Time or Timeline charts). This view displays horizontal bars along the time axis. Each bar represents a separate event with start and end values, hence these charts are used to track different activities during a specific time frame (e.g., for resource planning, overall project management, etc.). This chart type allows you to overlap activity bars from different series, so that one bar is displayed above another - to compare the duration of these tasks.
Note
To learn how to exclude holidays and weekends from an axis scale, refer to the following help topic: Data Aggregation.
An Overlapped Gantt chart is shown in the following image.
Since Gantt charts display the date-time axis (axis of values) horizontally, this chart type cannot be rotated. For this reason, the GanttDiagram.Rotated property for the GanttDiagram is hidden and unavailable.
Chart Type Characteristics
The table below lists the main characteristics of this chart type.
| Feature | Value |
|---|---|
| Series View type | OverlappedGanttSeriesView |
| Diagram type | 2D-GanttDiagram |
| Number of arguments per series point | 1 |
| Number of values per series point | 2 date-time values (Start and End) |
Note
For information on which chart types can be combined with the Overlapped Gantt Chart, refer to the following help topic: Combining Different Series Views.
Example
For a design-time example on how to create a Gantt chart, see the following help topic: How to: Create a Gantt Chart with Task Links.
The following example creates a ChartControl with two series of the OverlappedGanttSeriesView type, and adds this chart to a form at runtime. Before proceeding with this example, first create a Windows Forms Application in Visual Studio, and add all required assemblies to the project’s References list.
Then, add the following code to the Form.Load event handler.
using System;
using System.Windows.Forms;
using DevExpress.XtraCharts;
// ...
private void Form1_Load(object sender, EventArgs e) {
// Create a new chart.
ChartControl overlappedGanttChart = new ChartControl();
// Create two Gantt series.
Series series1 = new Series("Planned", ViewType.Gantt);
Series series2 = new Series("Completed", ViewType.Gantt);
// Set the date-time values scale type for both series,
// as it is qualitative, by default.
series1.ValueScaleType = ScaleType.DateTime;
series2.ValueScaleType = ScaleType.DateTime;
// Add points to them.
series1.Points.Add(new SeriesPoint("Market analysis", new DateTime[] {
new DateTime(2006, 8, 16), new DateTime(2006, 8, 23) }));
series1.Points.Add(new SeriesPoint("Feature planning", new DateTime[] {
new DateTime(2006, 8, 23), new DateTime(2006, 8, 26) }));
series1.Points.Add(new SeriesPoint("Implementation", new DateTime[] {
new DateTime(2006, 8, 26), new DateTime(2006, 9, 26) }));
series1.Points.Add(new SeriesPoint("Testing & bug fixing", new DateTime[] {
new DateTime(2006, 9, 26), new DateTime(2006, 10, 10) }));
series2.Points.Add(new SeriesPoint("Market analysis", new DateTime[] {
new DateTime(2006, 8, 16), new DateTime(2006, 8, 23) }));
series2.Points.Add(new SeriesPoint("Feature planning", new DateTime[] {
new DateTime(2006, 8, 23), new DateTime(2006, 8, 26) }));
series2.Points.Add(new SeriesPoint("Implementation", new DateTime[] {
new DateTime(2006, 8, 26), new DateTime(2006, 9, 10) }));
// Add both series to the chart.
overlappedGanttChart.Series.AddRange(new Series[] { series1, series2 });
// Access the view-type-specific options of the series.
((GanttSeriesView)series1.View).BarWidth = 0.6;
((GanttSeriesView)series2.View).BarWidth = 0.3;
// Access the type-specific options of the diagram.
GanttDiagram myDiagram = (GanttDiagram)overlappedGanttChart.Diagram;
myDiagram.AxisY.Interlaced = true;
myDiagram.AxisY.GridSpacing = 10;
myDiagram.AxisY.Label.Angle = -30;
myDiagram.AxisY.DateTimeOptions.Format = DateTimeFormat.MonthAndDay;
// Add task links for the first Gantt series.
((GanttSeriesView)series1.View).LinkOptions.ArrowHeight = 7;
((GanttSeriesView)series1.View).LinkOptions.ArrowWidth = 11;
for (int i = 1; i < series1.Points.Count; i++) {
series1.Points[i].Relations.Add(series1.Points[i - 1]);
}
// Add a progress line.
ConstantLine progress =
new ConstantLine("Current progress", new DateTime(2006, 9, 10));
progress.ShowInLegend = false;
progress.Title.Alignment = ConstantLineTitleAlignment.Far;
myDiagram.AxisY.ConstantLines.Add(progress);
// Adjust the legend.
overlappedGanttChart.Legend.AlignmentHorizontal =
LegendAlignmentHorizontal.Right;
// Add a title to the chart (if necessary).
overlappedGanttChart.Titles.Add(new ChartTitle());
overlappedGanttChart.Titles[0].Text = "R&D Schedule";
// Add the chart to the form.
overlappedGanttChart.Dock = DockStyle.Fill;
this.Controls.Add(overlappedGanttChart);
}