Gantt Diagram
- 3 minutes to read
This topic lists the series view types associated with the ASP.NET Chart Control’s Gantt diagram type. It also explains how to access specific options (both at design time and runtime), and briefly describes these options. Before reading this section, you may wish to review the following help topic on diagram fundamentals: Diagram Overview.
The topic consists of the following sections.
Associated Series View Types
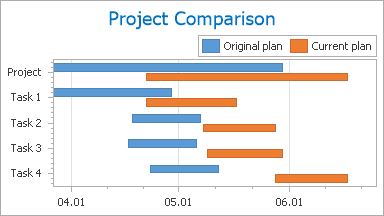
The Gantt diagram is used to plot series of the Side-by-Side and Overlapped Gantt view types. These views display horizontal bars along the date-time axis. Each bar represents a separate event with start and end values, so these charts are used to track different activities during a specific time frame (e.g., for resource planning, overall project management). This chart type allows you to overlap activity bars from different series, so that one bar is displayed above another - to compare the duration of these tasks. You can combine series of these view types within the same Gantt diagram.
A sample Gantt diagram is shown in the following image.

Note
Gantt charts display the date-time axis (axis of values) horizontally, so you cannot rotate this chart type. For this reason, the GanttDiagram.Rotated property for the GanttDiagram is hidden and unavailable.
Accessing a Diagram
You can access the Gantt diagram’s options at design time. Click the chart to select it, and expand the WebChartControl.Diagram property in the Properties window.
At runtime, cast your instance of the Diagram object to the GanttDiagram type.
// Create a new ChartControl instance.
ChartControl chart = new ChartControl();

// Create a series of the compatible view type,
// and add it to the chart's collection,
// so that the diagram object cannot be equal to null.
Series series1 = new Series("Gantt Series 1", ViewType.Gantt);
chart.Series.Add(series1);

// Create a diagram, and cast it to the GanttDiagram type.
GanttDiagram diagram = (GanttDiagram)chart.Diagram;
Specific Options
Since the GanttDiagram class is derived from the XYDiagram class, its set of properties is similar to the properties of the XY-Diagram. The only difference is that the GanttDiagram.Rotated property is hidden, and its value is always equal to true.
So, taking this sole difference into consideration, you can refer to the list of available options in the following document: XY-Diagram.