How to: Create a Gantt Chart with Task Links
- 5 minutes to read
The following example demonstrates how to create a Gantt chart at design time, add activity dependencies and a progress line, and improve the chart appearance. To display planned task durations and completions, add two sets of data to the chart, i.e. two different series of the Gantt type. The reason is that, for now, XtraCharts can’t automatically calculate the degree of task completion, so one series is used to represent tasks, and another series is used to represent their degree of completion.
This document consists of the following sections.
- Steps 1-6. Creating a New Chart and Adding Data
- Steps 7-8. Adding Relations and a Progress Line
- Steps 9-12. Customizing the Appearance
- Result
Steps 1-6. Creating a New Chart and Adding Data
- Start MS Visual Studio and create a new Windows Forms Application, or open an existing one.
Drop the ChartControl onto the form. Note that in this instance the Chart Wizard may be invoked (in case its “Show wizard every time a new chart is added” option is enabled). In this example, we don’t need to use the wizard, so click Cancel to close the wizard’s window and manually customize the ChartControl.
Dock the control to fill the form, by clicking Dock in parent container in the Chart’s actions list.
To add a new series to the chart, select the ChartControl, open its smart tag and choose the Series… item in the tasks list. Then, the Series Collection Editor will be invoked.
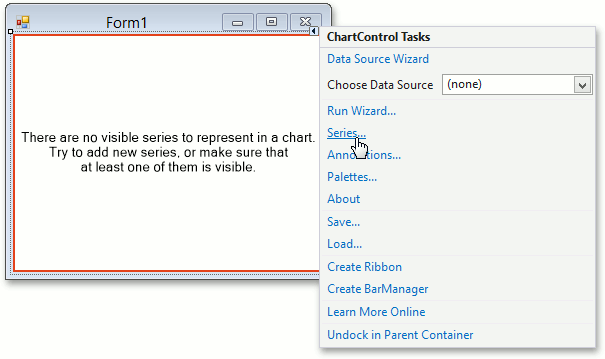
Note
Note that you may also invoke this editor by clicking on the ellipsis button for the ChartControl.Series property in the Properties window.
Then, a dialog appears that allows you to add a new series to a chart, and maintain their properties. Click Add… and select the Gantt series view from the list.

This series will display the planned duration. Switch to the Properties tab and change the series’ Name to Planned.
Click Copy to create the similar series.

Then, name that series Completed.
Add data points to series by filling in the grid at the Points tab of the Series Collection Editor, as shown in the following image.

Repeat this operation for the Completed data series.

Steps 7-8. Adding Relations and a Progress Line
In this step we will add activity dependencies (also called “task links” or “relations”). They will show the task order and indicate (in our instance) that an activity should not begin until the previous one is finished.
Use the TaskLink Collection Editor, that is invoked by clicking the button with an ellipsis (…) in the “Links” column at the Series Collection Editor window. The task link collection can be created for each data point in a series. This point becomes the Parent point of the relation. The Child data point is selected on the relation creation by clicking the Add button.

Add a task link to each point except the first, connecting it with a “Finish-to-Start” type link to the previous one. The linked points are listed below:
Parent Point Link Type Child Point Implementation Finish-to-Start Planning Demos&Docs Finish-to-Start Implementation Testing Finish-to-Start Demos&Docs Presentation Finish-to-Start Testing Note that in the link representation an arrow is oriented towards the parent point of relation.
A constant line will act as a progress line of a Gantt chart. Select the horizontal AxisY (date-time axis in this instance), Then, in the Property window, locate the Axis2D.ConstantLines property and click the ellipsis button opposite the property. and invoke the Constant Line Collection Editor. In the invoked Constant Line Collection Editor, click Add to add an item and set its ChartElementNamed.Name to Progress and ConstantLine.AxisValue - to 10/10/2008.

Steps 9-12. Customizing the Appearance
Now the chart is ready, but it seems clogged, and it’s difficult to distinguish between data labels and axis marks. To improve its appearance, do the following:
- Hide the chart legend, since it’s not very informative. Select it and set its LegendBase.Visibility property to False.
Select the date-time axis (AxisY). Change its AxisLabel.TextPattern to {V: MMMM dd},DateTimeScaleOptions.GridAlignment to Day, ScaleGridOptionsBase.GridSpacing of AxisBase.DateTimeScaleOptions - to 10 (that means one tick mark equals ten days).
Set the AxisBase.Interlaced property to true to lay out the diagram space by creating two sets of stripes with different colors, and alternating the tick marks along the axis.
Adjust the AxisLabel.Angle to -30 to visually separate the labels. Then you need an anti-aliasing option - set the TitleBase.EnableAntialiasing property of Axis2D.Label to true.
Hide the data series labels - set the SeriesBase.LabelsVisibility property to False for each data series.
Mark the task termination point with a common symbol for milestones - an inverted triangle. So, change the MarkerBase.Kindof RangeBarSeriesView.MaxValueMarker to Inverted Triangle for the “Planned” series, and set the RangeBarSeriesView.MaxValueMarkerVisibility property value to True
If we want the milestone to be solid black, we have to change the following properties of the MaxValueMarker - the Marker.Color - to Black, the MarkerBase.BorderVisible to false, and the FillStyle2D.FillMode of MarkerBase.FillStyle - to “Solid”.
- You can also change the bar’s width so two overlapping series would be clearly visible (BarSeriesView.BarWidth of SeriesBase.View = 0.5 and 0.3), and adjust the arrowhead dimensions (following properties of the GanttSeriesView.LinkOptions: TaskLinkOptions.ArrowHeight = 11, TaskLinkOptions.ArrowWidth = 9).
Result
The resulting chart is shown in the following image.
