Step Area Chart
Short Description
The Step Area Chart is represented by the StepAreaSeriesView object, which belongs to Area Series Views. This view is useful when you need to show to what extent values have changed for different points in the same series. Also, you can set the StepAreaSeriesView.InvertedStep property to true to specify whether these steps are shown as inverted or not.
A Step Area chart is shown in the image below. Note that this chart type is based upon the XYDiagram, so it can be rotated to show areas either vertically or horizontally.
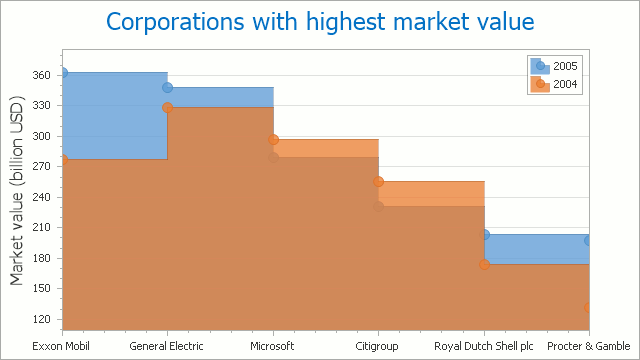
Chart Type Characteristics
The table below lists the main characteristics of this chart type.
| Feature | Value |
|---|---|
| Series View type | StepAreaSeriesView |
| Diagram type | 2D-XYDiagram |
| Number of arguments per series point | 1 |
| Number of values per series point | 1 |
Note
For information on which chart types can be combined with the Step Area Chart, refer to the Series Views Compatibility document.