Pane Layout
- 7 minutes to read
This topic explains how to arrange panes within a diagram and consists of the following sections:
- Automatically Arrange Panes
- Manually Arrange Panes
- Specify Pane Sizes
- Configure Layout in the Chart Designer
- Define Distance Between Panes
- Expand and Collapse Panes
Automatically Arrange Panes
The Chart control can automatically determine panes’ position and size. The GridPaneLayout.AutoLayoutMode property allows you to specify the mode the Chart control should use to arrange panes. The following layout modes are available:
- Linear. Panes are positioned sequentially.
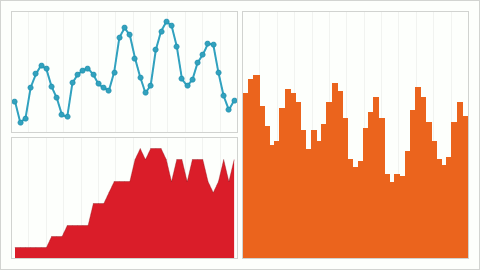
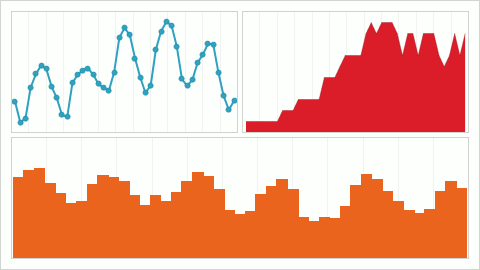
- Grid. Panes are positioned in a layout grid’s cells, one pane per cell.
Use the GridPaneLayout.Direction property to define panes’ alignment (vertical or horizontal).
The following images show the AutoLayoutMode and Direction properties in action:
| AutoLayoutMode = PaneAutoLayoutMode.Linear | AutoLayoutMode = PaneAutoLayoutMode.Grid | |
|---|---|---|
| Direction = PaneLayoutDirection.Vertical | 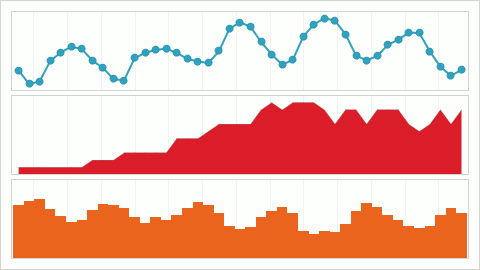 |
 |
| Direction = PaneLayoutDirection.Horizontal | 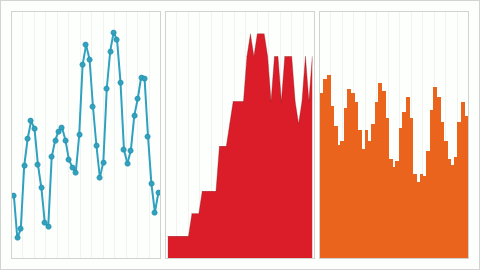 |
 |
The following code arranges panes vertically:
XYDiagram diagram = chart.Diagram as XYDiagram;
if(diagram != null) {
    diagram.PaneLayout.AutoLayoutMode = PaneAutoLayoutMode.Linear;
    diagram.PaneLayout.Direction = PaneLayoutDirection.Vertical;
}
The code above uses the following API members:
| Member | Description |
|---|---|
| XYDiagram2D.PaneLayout | Returns the diagram’s pane layout configuration. |
| GridPaneLayout.AutoLayoutMode | Specifies the mode that defines how the Chart control arranges panes. |
| PaneAutoLayoutMode | Lists all the layout patterns the diagram can use to position panes. |
| GridPaneLayout.Direction | Gets or sets the automatic layout pattern’s orientation. |
| PaneLayoutDirection | Lists the values that specify panes alignment direction. |
Manually Arrange Panes
You can arrange panes in a grid and add LayoutDefinition objects to the GridPaneLayout.ColumnDefinitions or GridPaneLayout.RowDefinitions collection to add new columns or rows to the layout. Use row and column indices to specify a pane’s position. The following image shows three panes in a grid with two columns and two rows:
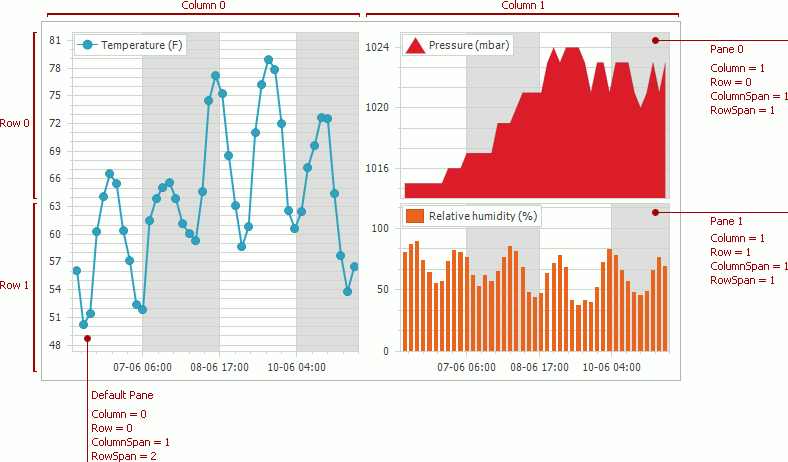
Use the following code to arrange panes as in the image above:
XYDiagram2D diagram = chartControl.Diagram as XYDiagram2D;
if(diagram != null) {
    diagram.PaneLayout.AutoLayoutMode = PaneAutoLayoutMode.Grid;

    diagram.PaneLayout.ColumnDefinitions.Add(new LayoutDefinition());
    diagram.PaneLayout.ColumnDefinitions.Add(new LayoutDefinition());
    diagram.PaneLayout.RowDefinitions.Add(new LayoutDefinition());
    diagram.PaneLayout.RowDefinitions.Add(new LayoutDefinition());

    diagram.DefaultPane.LayoutOptions.Column = 0;
    diagram.DefaultPane.LayoutOptions.Row = 0;
    diagram.DefaultPane.LayoutOptions.RowSpan = 2;

    diagram.Panes[0].LayoutOptions.Column = 1;
    diagram.Panes[0].LayoutOptions.Row = 0;

    diagram.Panes[1].LayoutOptions.Column = 1;
    diagram.Panes[1].LayoutOptions.Row = 1;
}
The following table lists the members the code above uses to configure panes’ layout:
| Member | Description |
|---|---|
| XYDiagram2D.PaneLayout | Returns the grid layout options’ storage. |
| GridPaneLayout | The grid layout options’ storage. |
| GridPaneLayout.RowDefinitions | Returns the grid layout’s rows. |
| GridPaneLayout.ColumnDefinitions | Returns the grid layout’s columns. |
| LayoutDefinition | A layout element (row or column) used to arrange panes. |
| XYDiagramPaneBase.LayoutOptions | Returns options that configure chart panes‘ layout. |
| GridLayoutOptions.Column | Gets or sets the index of the grid column the pane occupies. |
| GridLayoutOptions.ColumnSpan | Gets or sets the number of grid columns that the pane occupies. |
| GridLayoutOptions.Row | Gets or sets the index of the grid row the pane occupies. |
| GridLayoutOptions.RowSpan | Gets or sets the number of grid rows that the pane occupies. |
You can use the GridLayoutOptions.SetValues method at runtime to pass a Row and Column that the pane occupies. You can optionally define the RowSpan and ColumnSpan values with the SetValues method’s parameters.
Note
Note that the Column and Row properties do not affect a pane’s position when AutoLayoutMode is Linear.
Specify Pane Sizes
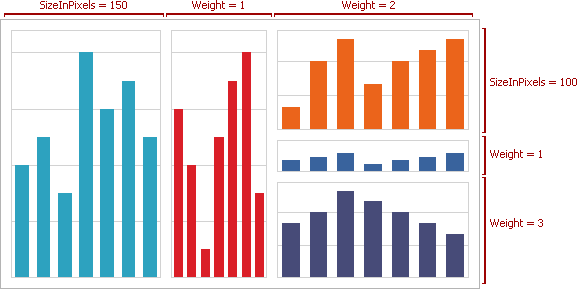
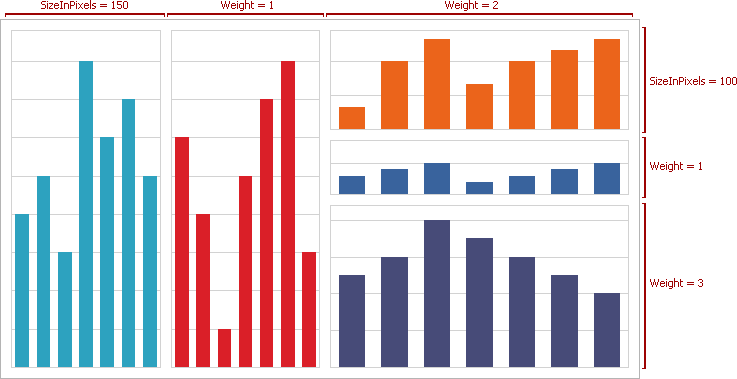
You can use a weight/pixel value to specify a grid’s row or column sizes.
Size in pixels. Set LayoutDefinition.SizeMode to UseSizeInPixels and then specify LayoutDefinition.SizeInPixels. In this case, a row or column size does not change when an end user resizes the chart.
Weight. Set LayoutDefinition.SizeMode to UseWeight and then specify LayoutDefinition.Weight. In this case, a row or column is resized proportionally to a diagram when an end user resizes the chart control.
The images below illustrate panes in different size modes and chart sizes.
480x270 pixels
640x360 pixels
The following code configures pane sizes in the grid layout:
private void OnFormLoad(object sender, EventArgs e) {
    XYDiagram diagram = chartControl1.Diagram as XYDiagram;
    if (diagram != null) {
        diagram.PaneLayout.AutoLayoutMode = PaneAutoLayoutMode.Grid;

        diagram.PaneLayout.ColumnDefinitions.Add(new LayoutDefinition { SizeMode = PaneSizeMode.UseSizeInPixels, SizeInPixels = 150 });
        diagram.PaneLayout.ColumnDefinitions.Add(new LayoutDefinition { SizeMode = PaneSizeMode.UseWeight, Weight = 1 });
        diagram.PaneLayout.ColumnDefinitions.Add(new LayoutDefinition { SizeMode = PaneSizeMode.UseWeight, Weight = 2 });

        diagram.PaneLayout.RowDefinitions.Add(new LayoutDefinition { SizeMode = PaneSizeMode.UseSizeInPixels, SizeInPixels = 100 });
        diagram.PaneLayout.RowDefinitions.Add(new LayoutDefinition { SizeMode = PaneSizeMode.UseWeight, Weight = 1 });
        diagram.PaneLayout.RowDefinitions.Add(new LayoutDefinition { SizeMode = PaneSizeMode.UseWeight, Weight = 3 });

        diagram.DefaultPane.LayoutOptions.Column = 0;
        diagram.DefaultPane.LayoutOptions.Row = 0;
        diagram.DefaultPane.LayoutOptions.RowSpan = 3;

        diagram.Panes[0].LayoutOptions.Column = 1;
        diagram.Panes[0].LayoutOptions.Row = 0;
        diagram.Panes[0].LayoutOptions.RowSpan = 3;

        diagram.Panes[1].LayoutOptions.Column = 2;
        diagram.Panes[1].LayoutOptions.Row = 0;

        diagram.Panes[2].LayoutOptions.Column = 2;
        diagram.Panes[2].LayoutOptions.Row = 1;

        diagram.Panes[3].LayoutOptions.Column = 2;
        diagram.Panes[3].LayoutOptions.Row = 2;
    }
}
The code sample above uses the following API members:
| Member | Description |
|---|---|
| LayoutDefinition.SizeMode | Gets or sets the value that defines how to change pane sizes when an end user resizes the chart. |
| PaneSizeMode | Lists modes that specify how to change a row or column size. |
| LayoutDefinition.SizeInPixels | Specifies a row or column size in pixels. |
| LayoutDefinition.Weight | Specifies a row’s or column’s relative size in relation to the diagram’s size. |
Note
You can use the ~Span properties to specify a pane’s weight when AutoLayoutMode is Linear. Use ColumnSpan to specify the weight when Direction is Horizontal. Use RowSpan to specify a pane’s weight when Direction is Vertical.
Configure Layout in the Chart Designer
- Run the Chart Designer.
- Select the XY-Diagram item in the elements’ tree.
Expand the PaneLayout properties’ group. Click the ColumnDefinitions (or RowDefinitions) property’s ellipsis button to show the Collection Edition to modify columns’ (or rows’) collections. In the Collection Editor, click Add to add a layout definition to a collection. Specify its SizeInPixels or Weight property (depending on the SizeMode property value) to modify a column or row size.
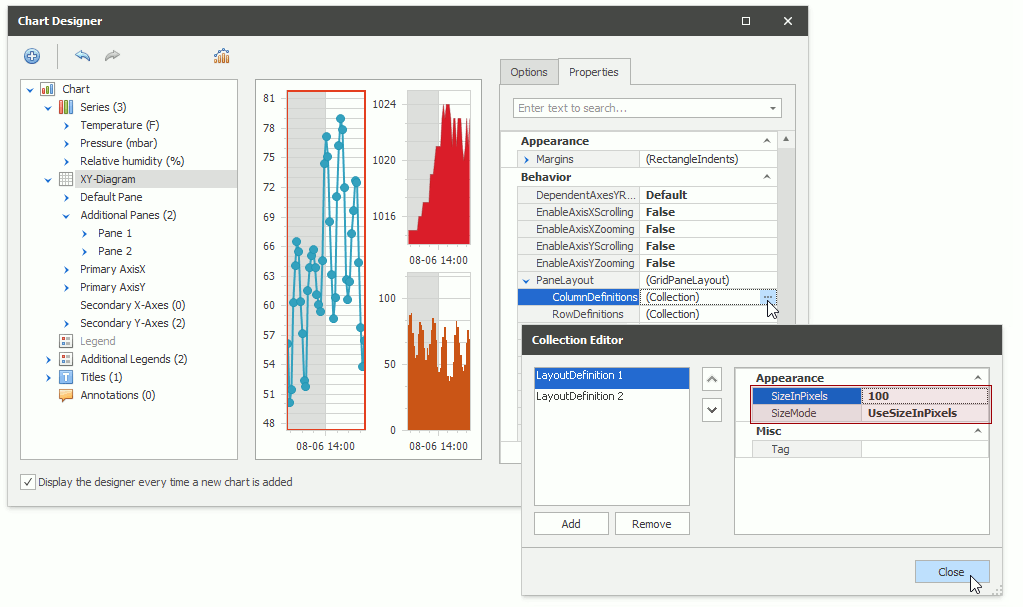
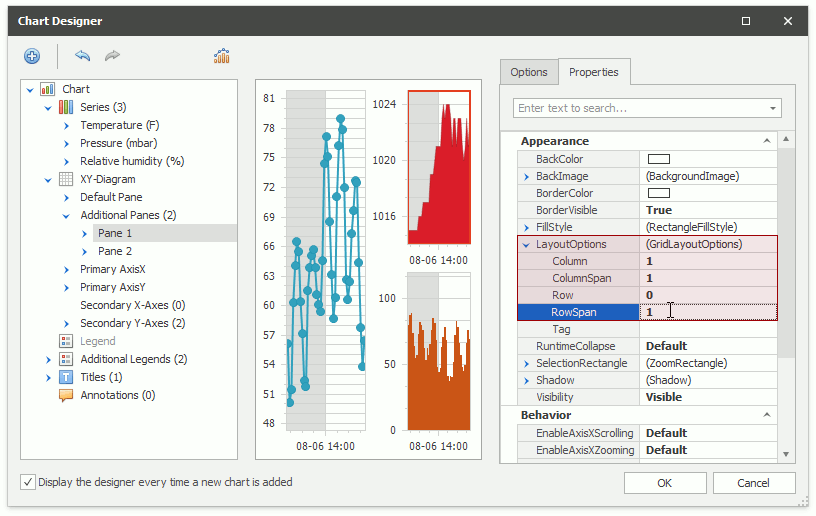
Select a pane in the Elements’ tree to configure its settings. Expand the LayoutOptions properties’ group in the Properties tab. Specify the Column, Row, ColumnSpan and RowSpan properties to set the pane’s position.
Define Distance Between Panes
The XYDiagram2D.PaneDistance property specifies indents between panes in pixels. The Chart control can add an extra space to the indents to draw axes and their elements.
| Layout Mode | Example |
|---|---|
| Linear Layout | 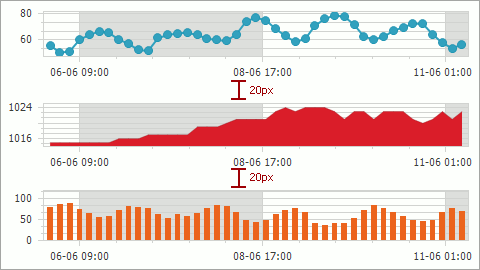 |
| Grid Layout | 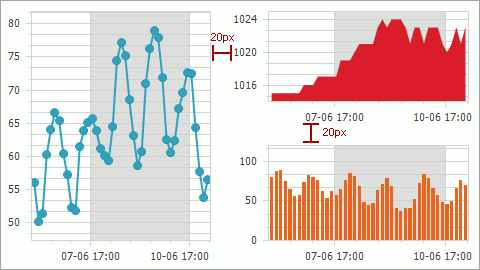 |
Expand, Collapse, and Resize Panes
End users can click the pane title or its expand button to expand or collapse panes at runtime. The Chart control recalculates other panes’ sizes to occupy all the available place within the diagram when an end user collapses the pane. The XYDiagram2D.RuntimePaneCollapse property allows you to enable collapsing panes. Use the XYDiagramPaneBase.RuntimeCollapse property to specify whether end users can collapse or expand an individual pane.
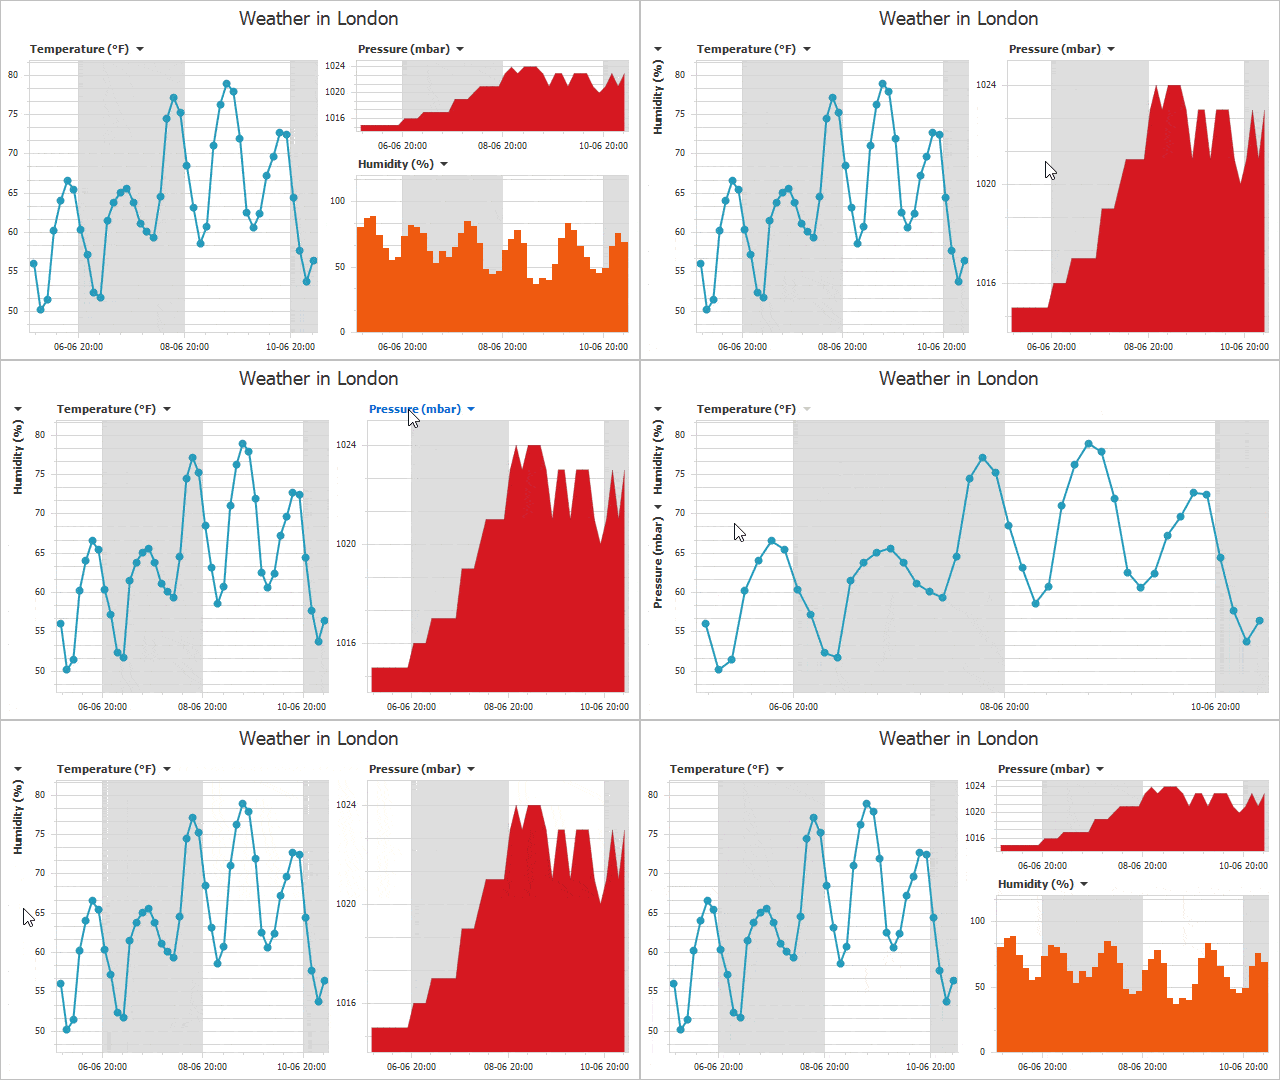
Enable the XYDiagram2D.RuntimePaneResize property to allow a user to resize chart panes.