Axis Ranges
- 9 minutes to read
Whole and Visual axis ranges define the data that an axis displays. The whole range specifies the data source values the chart displays at the minimum zoom level. If whole range limits are not set, the whole range is calculated based on the data of all series associated with the axis. The visual range depends on the zoom level and is initially equal to the whole range. You can modify ranges of both x- and y-axes.
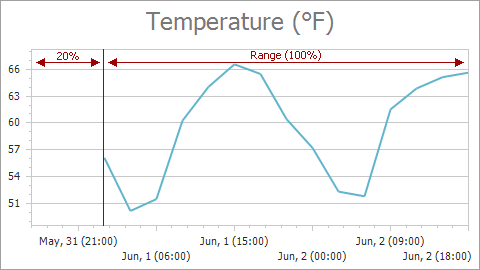
| An x-axis’s visual range is equal to a whole range (default) | An x-axis’s visual range is less than a whole range |
|---|---|
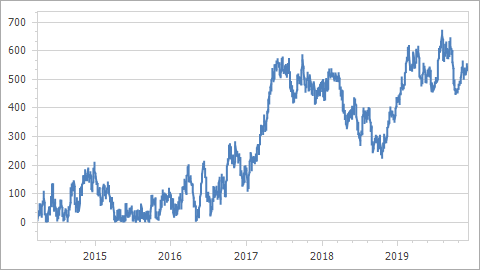 |
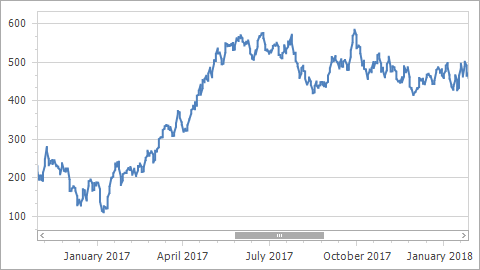 |
- How End Users Can Change a Visual Range
- Configure Visual and Whole Ranges
- Specify Diagram Side Margins
- Hide Zero Level on a Chart Value Axis
- Configure Y-Axis’s Range Based on X-Axis’s Visual Range
How End Users Can Change a Visual Range
Users can pan and zoom a chart to change the visual range. To allow users to scroll and zoom a chart, enable the following properties:
XYDiagram2D.EnableAxisXZooming (use XYDiagramPaneBase.EnableAxisXZooming for a particular pane)
XYDiagram2D.EnableAxisXScrolling (use XYDiagramPaneBase.EnableAxisXScrolling for a particular pane)
XYDiagram2D.EnableAxisYZooming (use XYDiagramPaneBase.EnableAxisYZooming for a particular pane)
XYDiagram2D.EnableAxisYScrolling (use XYDiagramPaneBase.EnableAxisYScrolling for a particular pane)
XYDiagram diagram = chartControl1.Diagram as XYDiagram;

diagram.EnableAxisXScrolling = true;
diagram.EnableAxisXZooming = true;

diagram.EnableAxisYScrolling = true;
diagram.EnableAxisYZooming = true;
Refer to Zoom and Scroll in 2D XY-Charts and Zooming and Scrolling (3D Charts) for more information.
Configure Visual and Whole Ranges
The Range class provides base functionality for WholeRange and VisualRange. To access whole and visual range parameters, use the AxisBase.WholeRange and AxisBase.VisualRange properties.
Range limits are automatically calculated when the Range.Auto property is enabled. To specify range limits, use the Range.MinValue and Range.MaxValue properties. Alternatively, you can call the Range.SetMinMaxValues method to pass minimum and maximum range values. The following examples show how to configure a whole range for different axis types:
How to Limit the Numeric Axis Range
XYDiagram diagram = chartControl1.Diagram as XYDiagram;

// Set limits for an x-axis's whole range
diagram.AxisX.WholeRange.MinValue = 500;
diagram.AxisX.WholeRange.MaxValue = 2000;
// or use the SetMinMaxValues method to specify range limits.
diagram.AxisX.WholeRange.SetMinMaxValues(500, 2000);

// Set limits for an x-axis's visual range
diagram.AxisX.VisualRange.MinValue = 1000;
diagram.AxisX.VisualRange.MaxValue = 1500;
// or use the SetMinMaxValues method to specify range limits.
diagram.AxisX.VisualRange.SetMinMaxValues(1000, 1500);
How to Limit the Date-Time Axis Range
XYDiagram diagram = chartControl1.Diagram as XYDiagram;

// Set limits for an x-axis's whole range
diagram.AxisX.WholeRange.MinValue = new DateTime(2017, 01, 01);
diagram.AxisX.WholeRange.MaxValue = new DateTime(2019, 12, 31);
// or use the SetMinMaxValues method to specify range limits.
diagram.AxisX.WholeRange.SetMinMaxValues(new DateTime(2017, 01, 01), new DateTime(2019, 12, 31));

// Set limits for an x-axis's visual range
diagram.AxisX.VisualRange.MinValue = new DateTime(2018, 01, 01);
diagram.AxisX.VisualRange.MaxValue = new DateTime(2019, 01, 01);
// or use the SetMinMaxValues method to specify range limits.
diagram.AxisX.VisualRange.SetMinMaxValues(new DateTime(2018, 01, 01), new DateTime(2019, 01, 01));
How to Limit the Time-Span Axis Range
XYDiagram diagram = chartControl1.Diagram as XYDiagram;

// Set limits for an x-axis's whole range
diagram.AxisX.WholeRange.MinValue = new TimeSpan(0,0,0);
diagram.AxisX.WholeRange.MaxValue = new TimeSpan(1, 0, 0, 0);
// or use the SetMinMaxValues method to specify range limits.
diagram.AxisX.WholeRange.SetMinMaxValues(new TimeSpan(0, 0, 0), new TimeSpan(1, 0, 0, 0));

// Set limits for an x-axis's visual range
diagram.AxisX.VisualRange.MinValue = new TimeSpan(6, 0, 0);
diagram.AxisX.VisualRange.MaxValue = new TimeSpan(12, 0, 0);
// or use the SetMinMaxValues method to specify range limits.
diagram.AxisX.VisualRange.SetMinMaxValues(new TimeSpan(6, 0, 0), new TimeSpan(12, 0, 0));
How to Limit the Qualitative Axis Range
XYDiagram diagram = chartControl1.Diagram as XYDiagram;

// Use the actual string categories from the data source.
// Set limits for an x-axis's whole range
diagram.AxisX.WholeRange.MinValue = "Camera";
diagram.AxisX.WholeRange.MaxValue = "Flash";
// or use the SetMinMaxValues method to specify range limits.
diagram.AxisX.WholeRange.SetMinMaxValues("Camera", "Flash");

// Set limits for an x-axis's visual range
diagram.AxisX.VisualRange.MinValue = "Camcorder";
diagram.AxisX.VisualRange.MaxValue = "Binoculars";
// or use the SetMinMaxValues method to specify range limits.
diagram.AxisX.VisualRange.SetMinMaxValues("Camcorder", "Binoculars");
The Chart Control recalculates the maximum and minimum range values as float numbers for Qualitative, DateTime, and TimeSpan axes (see Axis Scale Types for more information). These float equivalents are available via the Range.MinValueInternal and Range.MaxValueInternal properties.
Use the AxisBase.GetScaleValueFromInternal(System.Double) method to convert an internal numerical value to its equivalent for a DateTime, TimeSpan or Qualitative axis.
The following example displays the first five series points when you use a qualitative axis and the fifth argument value is unknown:
XYDiagram diagram = (XYDiagram)chartControl1.Diagram;
diagram.AxisX.VisualRange.MinValue = diagram.AxisX.GetScaleValueFromInternal(0);
diagram.AxisX.VisualRange.MaxValue = diagram.AxisX.GetScaleValueFromInternal(4);
When you change an axis’s MeasureUnit (DateTimeScaleOptions.MeasureUnit, TimeSpanScaleOptions.MeasureUnit or NumericScaleOptions.MeasureUnit) property, the range limits are reset to default values. For this reason, specify the MeasureUnit value first to configure the MeasureUnit and the range’s limits.
Specify Diagram Side Margins
The Chart Control adds additional margins between the outermost series point and the diagram’s edge. To configure margins, use the Range.StartSideMargin, Range.EndSideMargin or Range.SideMarginsValue properties.
The SideMarginSizeUnit property defines margin measurement units. When SideMarginSizeUnit is set to SideMarginSizeUnit.AxisUnit (the default value), margins are specified in axis measurement units.
| Property Value | Example |
|---|---|
| WholeRange.SideMarginsValue = 200 | 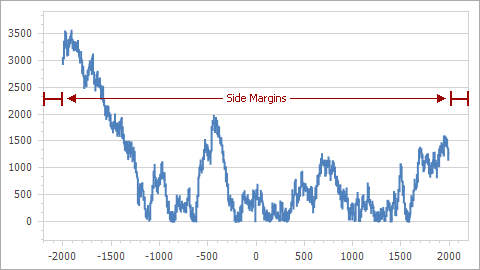 |
| WholeRange.SideMarginsValue = 0 | 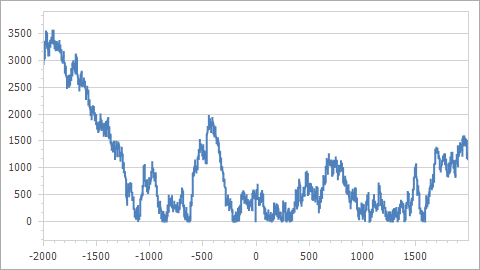 |
XYDiagram diagram = chartControl1.Diagram as XYDiagram;
diagram.AxisX.WholeRange.SideMarginsValue = 0;
Set Range.SideMarginSizeUnit to SideMarginSizeUnit.AxisRangePercentage to define margins as a percentage of the axis range.
The following example shows how to set the left margin as a percentage:
XYDiagram diagram = chart.Diagram as XYDiagram;
diagram.AxisX.WholeRange.SideMarginSizeUnit = SideMarginSizeUnit.AxisRangePercentage;
diagram.AxisX.WholeRange.StartSideMargin = 20;
If you specify the SideMarginsValue, StartSideMargin or EndSideMargin properties, the control ignores the Range.AutoSideMargins property.
Hide Zero Level on a Chart Value Axis
If you want your y-axis to start at the first value, disable the WholeRange.AlwaysShowZeroLevel property. In this case, a new minimum value is calculated for the y-axis based on the underlying data.
| Property Value | Example |
|---|---|
| AlwaysShowZeroLevel = false | 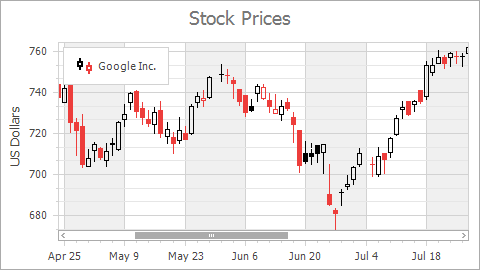 |
| AlwaysShowZeroLevel = true | 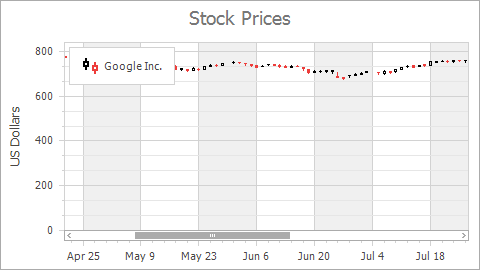 |
XYDiagram diagram = chartControl1.Diagram as XYDiagram;
diagram.AxisY.WholeRange.AlwaysShowZeroLevel = false;
Configure Y-Axis’s Range Based on X-Axis’s Visual Range
The y-axis visual range is determined based on the x-axis whole range. To make a y-axis calculate its range based on the x-axis visual range only, set the XYDiagram2D.DependentAxesYRange property to true. Use the AxisXBase.StickToEdge property to specify whether the visual range sticks to the whole range’s start or end.
| Property Value | Example |
|---|---|
| DependentAxesYRange = false |  |
| DependentAxesYRange = true |  |
XYDiagram diagram = chartControl1.Diagram as XYDiagram;
diagram.DependentAxesYRange = DevExpress.Utils.DefaultBoolean.True;
diagram.AxisX.StickToEdge = true;
diagram.AxisX.WholeRange.SideMarginsValue = 2;
diagram.AxisX.VisualRange.SetMinMaxValues((double)diagram.AxisX.WholeRange.MaxValue - 20, diagram.AxisX.WholeRange.MaxValue);
Track Range Changes
The Chart Control’s ChartControl.AxisWholeRangeChanged and ChartControl.AxisVisualRangeChanged events track range changes. To obtain previous and new limits for a changed range, use the AxisRangeChangedEventArgs.MinChange and AxisRangeChangedEventArgs.MaxChange properties.
chartControl1.AxisVisualRangeChanged += OnChartControlAxisVisualRangeChanged;
//...
private void OnChartControlAxisVisualRangeChanged(object sender, AxisRangeChangedEventArgs e) {
    if (e.Axis is AxisX) {
        StringBuilder str = new StringBuilder();
        str.Append($"Measure Unit: <b>{e.Axis.DateTimeScaleOptions.MeasureUnit}</b>{Environment.NewLine}");
        str.Append($"Min Value changed from <b>{e.MinChange.OldValue}</b> to <b>{e.MinChange.NewValue}</b>{Environment.NewLine}");
        str.Append($"Max Value changed from <b>{e.MaxChange.OldValue}</b> to <b>{e.MaxChange.NewValue}</b>");
        ((AxisX)e.Axis).Title.Visibility = DefaultBoolean.True;
        ((AxisX)e.Axis).Title.Text = str.ToString();
    }
}