Axis Scale Types
- 12 minutes to read
This topic explains how to specify axis scale options for different types of series point arguments and values (Numerical, Date-Time, Time-Span, and Qualitative). Scale options allow you to set scale parameters as an axis measurement unit, grid spacing, grid offset, an aggregate function, and so on.
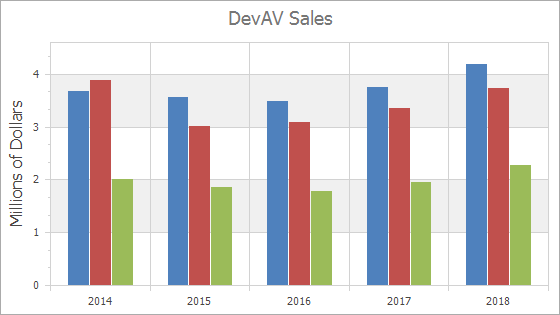
Numeric x-axis
DateTime x-axis
TimeSpan x-axis
Qualitative x-axis
Tip
Refer to the Choosing between DateTime, DateTimeOffset, TimeSpan, and TimeZoneInfo document (see the The DateTime structure and The TimeSpan structure sections) for more information about DateTime and TimeSpan values.
To format text labels the Chart displays on an axis, use the AxisLabel.TextPattern property.
You can configure whole and visual ranges to limit the axis scale value range.
Determine X-Axis Scale Type Automatically
The Chart Control determines an x-axis’s scale type based on underlying data (the SeriesBase.ArgumentScaleType property is set to Auto). Note that this operation requires additional CPU and RAM resources. Use the SeriesBase.ArgumentScaleType property to explicitly specify the argument type. See Performance: Automatic Calculations for more information.
Numerical, Date-Time and Time-Span Axis Scale Modes
The scale mode defines how the Chart aggregates series point values. The following modes are available for x-axes. Y-axes always have a continuous scale.
Scale Mode | Description |
|---|---|
Automatic | When used, automatic aggregation is applied to data based on the data set’s values, the Chart Control’s current size, and zoom level. |
Continuous | The Chart Control’s does not aggregate data. |
Manual | An axis scale is divided into intervals based on the measurement unit (NumericScaleOptions.MeasureUnit, DateTimeScaleOptions.MeasureUnit, or TimeSpanScaleOptions.MeasureUnit). An aggregate function applies to each interval. |
Interval | When used, axis labels display intervals, for example, (100, 200], (200, 300]. Use the IntervalOptionsBase.Pattern property to change the display format for axis labels. This mode allows you to create histograms. |
Handle an Axis with a Numeric Scale
The Chart Control interprets series point arguments and values as numbers when the scale type is Numerical.
To make the Chart process arguments/values as numbers, set the SeriesBase.ArgumentScaleType/SeriesBase.ValueScaleType property to ScaleType.Numerical.
Series series = chartControl1.Series[0];
series.ArgumentScaleType = ScaleType.Numerical;
series.ValueScaleType = ScaleType.Numerical;
Use the AxisBase.NumericScaleOptions property to access axis scale parameters:
NumericScaleOptions xAxisOptions = ((XYDiagram)chartControl1.Diagram).AxisX.NumericScaleOptions;
xAxisOptions.ScaleMode = ScaleMode.Manual;
xAxisOptions.GridSpacing = 5;
xAxisOptions.GridAlignment = NumericGridAlignment.Hundreds;
xAxisOptions.AggregateFunction = AggregateFunction.Average;
// Other scale settings.
// ...

NumericScaleOptions yAxisOptions = ((XYDiagram)chartControl1.Diagram).AxisY.NumericScaleOptions;
yAxisOptions.GridOffset = 200;
yAxisOptions.GridSpacing = 500;
// Other scale settings.
// ...
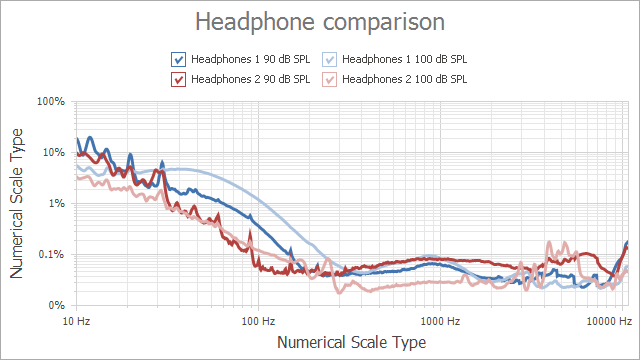
Display Numeric Values on a Logarithmic Scale
You can use a logarithmic scale to display numeric values. The Chart Control allows you to specify a logarithm’s base (the default value is 10).
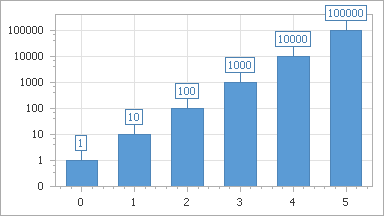
A logarithmic scale is enabled for the y-axis.
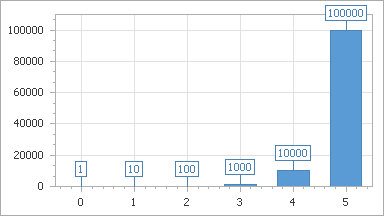
A logarithmic scale is disabled.
The following example enables the logarithmic view for a y-axis:
XYDiagram diagram = chartControl1.Diagram as XYDiagram;
diagram.AxisY.Logarithmic = true;
diagram.AxisY.LogarithmicBase = 10;
The example above uses the following API members:
| Member | Description |
|---|---|
| AxisBase.Logarithmic | Gets or sets whether the axis should display its numerical values using a logarithmic scale. |
| AxisBase.LogarithmicBase | Gets or sets a value specifying a logarithmic base when the AxisBase.Logarithmic property is enabled. |
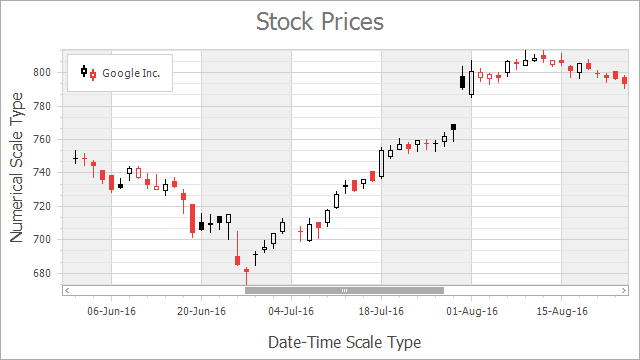
Handle an Axis with a Date-Time Scale
The Chart Control can handle series point arguments/values as DateTime, DateOnly, or TimeOnly values, for example, 01/01/2017 18:00, November 10.
Note
DateOnly and TimeOnly values are incompatible and cannot be used simultaneously on a single axis.
To make the Chart process arguments/values as numbers, set the SeriesBase.ArgumentScaleType/SeriesBase.ValueScaleType property to ScaleType.DateTime.
Series series = chartControl1.Series[0];
series.ArgumentScaleType = ScaleType.DateTime;
series.ValueScaleType = ScaleType.DateTime;
Use the AxisBase.DateTimeScaleOptions property to access date-time axis parameters:
DateTimeScaleOptions xAxisOptions = ((XYDiagram)chartControl1.Diagram).AxisX.DateTimeScaleOptions;
xAxisOptions.AggregateFunction = AggregateFunction.Average;
// Other scale settings.
// ...
DateTimeScaleOptions yAxisOptions = ((XYDiagram)chartControl1.Diagram).AxisY.DateTimeScaleOptions;
yAxisOptions.GridSpacing = 5;
// Other scale settings.
// ...
Tip
You can exclude holidays, weekends, or specific hours from a date-time axis’s scale.
Customize a Date-Time Axis’s Label Display Mode
Use the DateTimeScaleOptions.GridAlignment property to choose a date-time unit used to display axis labels.
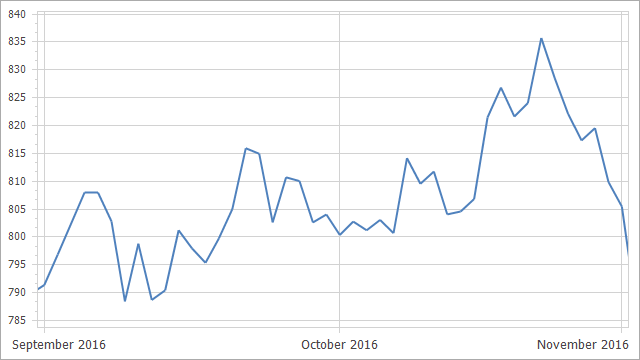
The date-time x-axis’s alignment is set to Month.
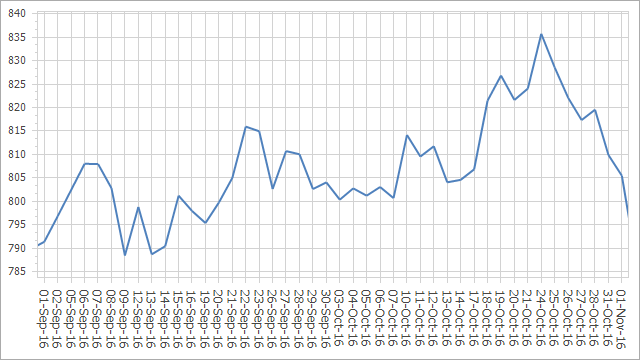
The date-time x-axis’s alignment is set to Day.
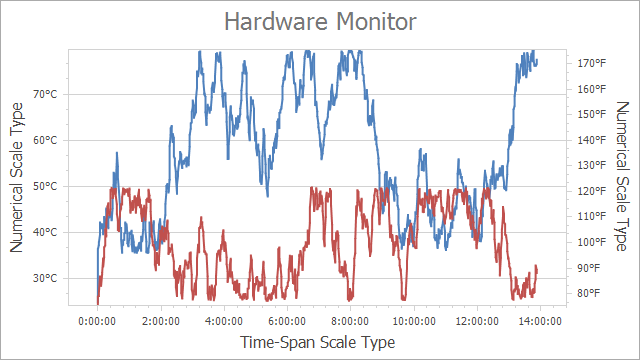
Handle an Axis with a Time-Span Scale
The Chart Control can handle series point arguments/values as TimeSpan values, for example, 00:00:00, 00:00:01, 1.12:00:00, etc.
To make the Chart process arguments/values as TimeSpan values, set the SeriesBase.ArgumentScaleType/SeriesBase.ValueScaleType property to ScaleType.TimeSpan.
Series series = chartControl1.Series[0];
series.ArgumentScaleType = ScaleType.TimeSpan;
series.ValueScaleType = ScaleType.TimeSpan;
Use the AxisBase.TimeSpanScaleOptions property to access a time-span axis parameters:
TimeSpanScaleOptions xAxisOptions = ((XYDiagram)chartControl1.Diagram).AxisX.TimeSpanScaleOptions;
TimeSpanScaleOptions yAxisOptions = ((XYDiagram)chartControl1.Diagram).AxisY.TimeSpanScaleOptions;
Customize a Time-Span Axis’s Label Display Mode
Use the TimeSpanScaleOptions.GridAlignment property to select the date-time unit for axis labels.
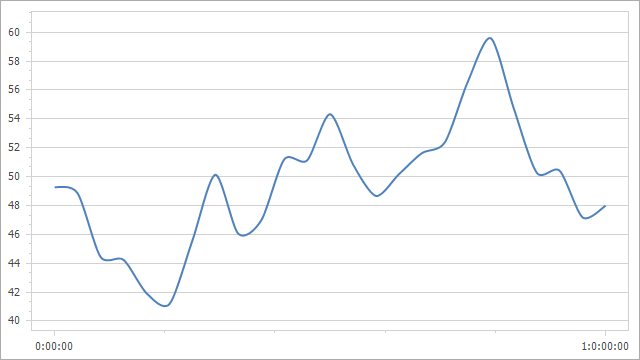
The time-span x-axis’s alignment is set to Day.
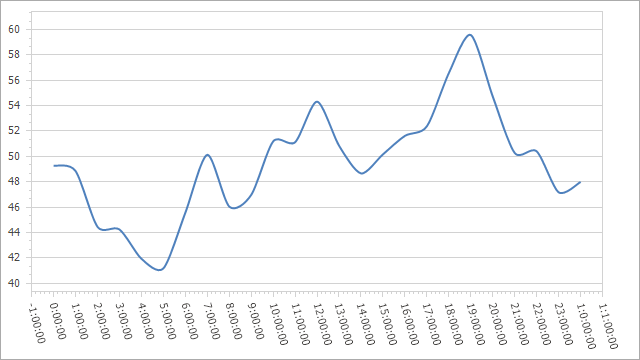
The time-span x-axis’s alignment is set to Hour.
Define Measurement Units for Numerical, Date-Time, and Time-Span Axes
The Chart Control can create large gaps between series points if an incorrect measurement unit is used.
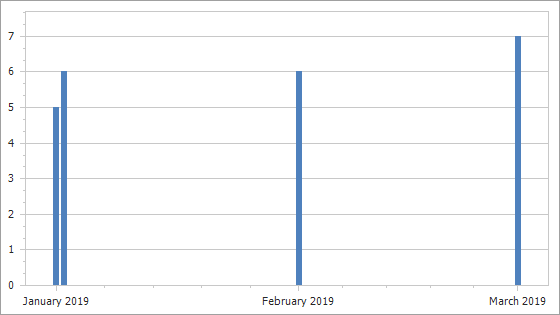
MeasureUnit = Day (default)
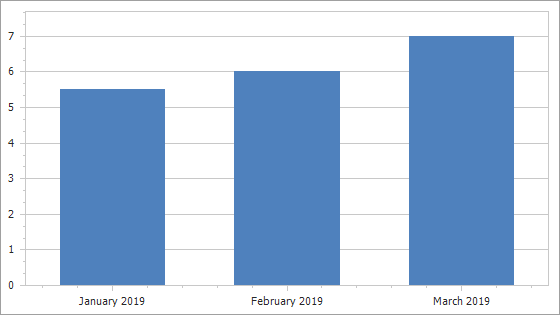
MeasureUnit = Month
The charts above visualize the following data:
| Argument (“yyyy/mm/dd”) | Value |
|---|---|
| 2019/01/01 | 5 |
| 2019/01/02 | 6 |
| 2019/02/01 | 6 |
| 2019/03/01 | 7 |
To improve the chart’s readability, use the MeasureUnit property to define the correct measurement unit for your data. Data points with the same measurement unit are aggregated into one point (for example, data points in the same month). The following table lists default measurement units for various scale types. To change the measurement unit, use one of the properties below:
| Default Measurement Unit | Property |
|---|---|
| Day | DateTimeScaleOptions.MeasureUnit |
| Second | TimeSpanScaleOptions.MeasureUnit |
| Ones | NumericScaleOptions.MeasureUnit |
The following code snippet specifies the measurement unit for a date-time x-axis:
DateTimeScaleOptions xAxisOptions = ((XYDiagram)chartControl1.Diagram).AxisX.DateTimeScaleOptions;

xAxisOptions.MeasureUnit = DateTimeMeasureUnit.Month;
xAxisOptions.GridSpacing = 1;
xAxisOptions.ScaleMode = ScaleMode.Manual;
xAxisOptions.GridAlignment = DateTimeGridAlignment.Month;
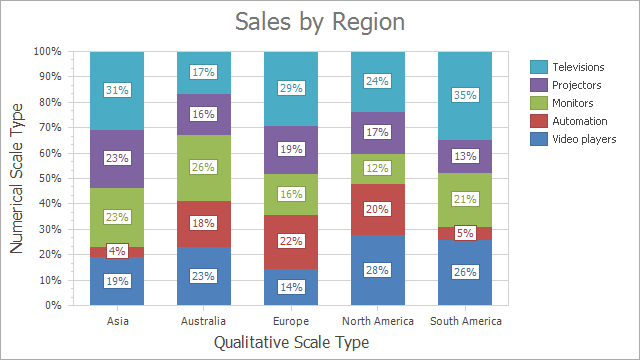
Handle an Axis with a Qualitative Scale
The qualitative axis scale allows you to handle series with string category arguments (for example, A, B, C, X, XII). Note that the qualitative scale type is only available for x-axes.
To make the Chart process arguments as qualitative values, set the SeriesBase.ArgumentScaleType property to ScaleType.Qualitative.
Series series = chartControl1.Series[0];
series.ArgumentScaleType = ScaleType.Qualitative;
To change a qualitative x-axis options, use its QualitativeScaleOptions (AxisXBase.QualitativeScaleOptions or AxisX3D.QualitativeScaleOptions).
QualitativeScaleOptions xAxisOptions = ((XYDiagram)chartControl1.Diagram).AxisX.QualitativeScaleOptions;
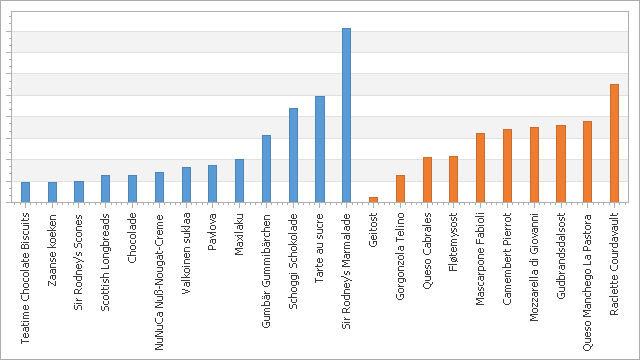
The following images show how a qualitative axis works with various qualitative series points’ arguments:
Qualitative arguments follow one after another when series have different qualitative arguments:
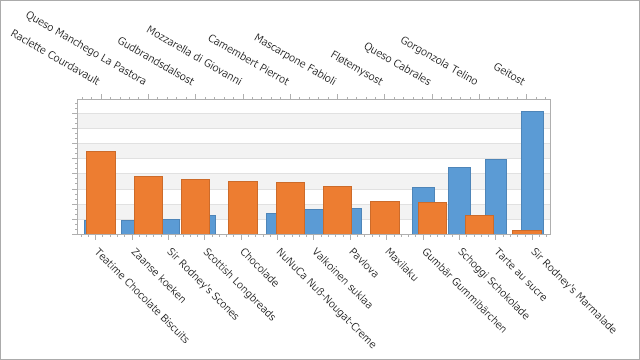
Series overlap when one series uses a secondary axis:
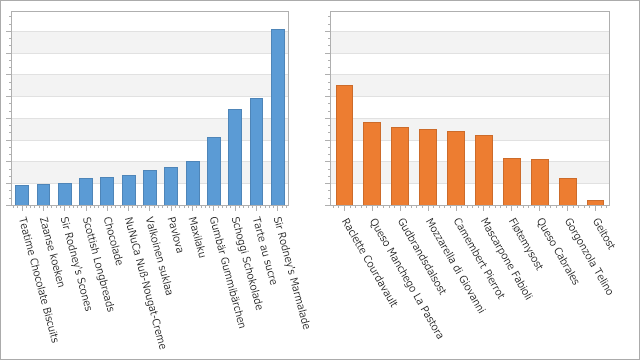
You can plot a series in a separate pane to resolve overlapping series:
Different series’ points are grouped by equal string arguments:
Prevent Hiding Axis Labels
The Chart Control hides axis labels if there is insufficient space. To show all the string arguments for the data series when you use a qualitative scale, disable ScaleGridOptionsBase.AutoGrid, set ScaleGridOptionsBase.GridSpacing to 1, and change the Resolve Overlapping Algorithm options.
XYDiagram diagram = chartControl1.Diagram as XYDiagram;
diagram.AxisX.QualitativeScaleOptions.AutoGrid = false;
diagram.AxisX.QualitativeScaleOptions.GridSpacing = 1;
diagram.AxisX.Label.ResolveOverlappingOptions.AllowHide = false;
Reorder Qualitative Axis Values
You can sort qualitative values to put them in specific order. The images below show the default and custom qualitative value order.
| Image | Description |
|---|---|
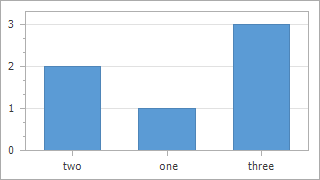 |
The qualitative values are plotted in the same order as series points in the collection. |
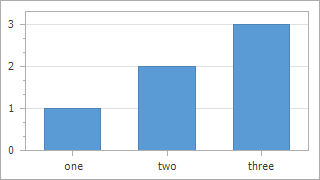 |
The custom qualitative value order applies. |
Assign an object of a class that implements the IComparer interface to the AxisBase.QualitativeScaleComparer property.
using System;
using System.Collections;

namespace QualitativeScaleCustomSortOrderSample {
    class NumberComparer : IComparer {
        public int Compare(object x, object y) {
            int iX = NumberConverter.ToInt(x);
            int iY = NumberConverter.ToInt(y);
            return iX - iY;
        }
    }

    class NumberConverter {
        public static int ToInt(object o) {
            string stringNumber = o as string;
            int number = 0;
            if (stringNumber == null) return -1;
            if (Int32.TryParse(stringNumber, out number))
                return number;
            switch (stringNumber.ToLower()) {
                case "one": return 1;
                case "two": return 2;
                case "three": return 3;
            }
            return number;
        }
    }
}
Change Intervals between Major Tick Marks
Use the ScaleGridOptionsBase.GridSpacing property to customize intervals between major tickmarks.
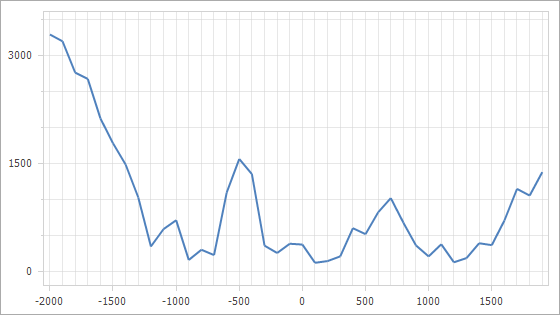
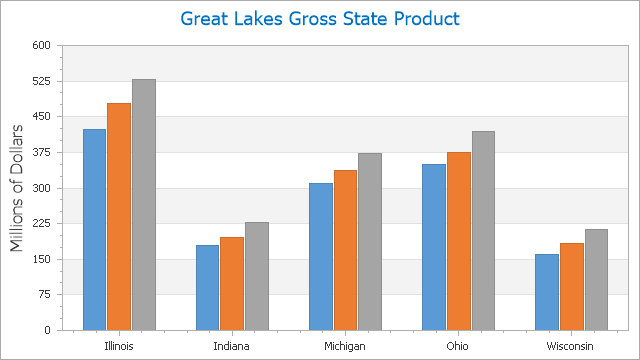
The x-axis’s grid spacing is equal to 500; the y-axis’s grid spacing is equal to 1500.
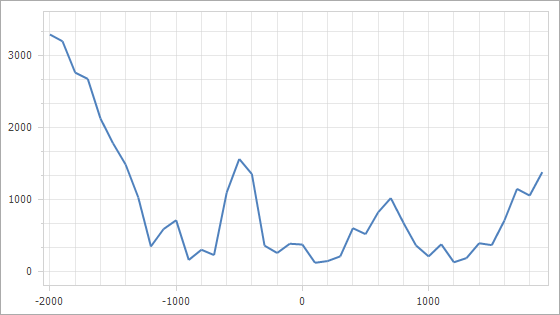
The x-axis’s grid spacing is equal to 1000; the y-axis’s grid spacing is equal to 1000.
NumericScaleOptions xAxisOptions = ((XYDiagram)chartControl1.Diagram).AxisX.NumericScaleOptions;
xAxisOptions.GridSpacing = 500;
NumericScaleOptions yAxisOptions = ((XYDiagram)chartControl1.Diagram).AxisY.NumericScaleOptions;
yAxisOptions.GridSpacing = 1500;
Customize Layout of Grid Lines and Axis Labels
Use the GridLayoutMode (DateTimeScaleOptions.GridLayoutMode, NumericIntervalOptions.GridLayoutMode, QualitativeScaleOptions.GridLayoutMode or TimeSpanScaleOptions.GridLayoutMode) property to rearrange grid lines, labels, and tickmarks.

A grid line, major tickmark, and axis label are in an interval center.

A grid line, major tickmark, and axis label are shifted to an interval start value.
A grid line and major tickmark are shifted to an interval start value. An axis label is in the interval center.
XYDiagram diagram = chartControl1.Diagram as XYDiagram;
diagram.AxisX.DateTimeScaleOptions.GridLayoutMode = GridLayoutMode.GridShiftedLabelCentered;
diagram.AxisX.GridLines.Visible = true;
Update Axis Scale Dynamically
It is possible to update scale mode, measure unit, grid alignment, or grid spacing dynamically.
Handle the ChartControl.AxisScaleChanged event to obtain the axis‘ automatically calculated grid alignment and measurement unit values when the scale mode is automatic. The event arguments also contain the axis itself. This event occurs when the scale mode, measure unit, grid alignment, or grid spacing of the axis scale has been changed.
private void Form1_Load(object sender, EventArgs e) {
    this.ordersTableAdapter.Fill(this.nwindDataSet.Orders);
    this.chartControl.AxisScaleChanged += OnAxisScaleChanged;
}

private void OnAxisScaleChanged(object sender, AxisScaleChangedEventArgs e) {
    AxisX axis = e.Axis as AxisX;
    DateTimeScaleChangedEventArgs args = e as DateTimeScaleChangedEventArgs;
    if ((args == null) || (args == null)) return;
    axis.Title.Text = String.Format(
        "The Axis Grid Alignment Unit is {0}\r\nThe Axis Measure Unit is {1}",
        args.GridAlignmentChange.NewValue,
        args.MeasureUnitChange.NewValue);
}
Note that the event args type depends on the current axis scale type. The following table shows dependencies between scale types and argument types.
| Scale type | Args type |
|---|---|
| Qualitative | QualitativeScaleChangedEventArgs |
| Numeric | NumericScaleChangedEventArgs |
| Date-Time | DateTimeScaleChangedEventArgs |
| Time-Span | TimeSpanScaleChangedEventArgs |
Update Grid Spacing Dynamically
You can handle the ChartControl.AxisScaleChanged event to obtain the axis‘ automatically calculated grid alignment and measurement unit values when the scale mode is automatic.
This example shows how to dynamically update the GridSpacing value at runtime to display no fractional values:
private void chartControl1_AxisScaleChanged(object sender, DevExpress.XtraCharts.AxisScaleChangedEventArgs e) {
    if (e.Axis is AxisY) {
        if (e.GridSpacingChange.NewValue % 1 != 0) {
            e.Axis.NumericScaleOptions.GridSpacing = 1;
        }
    }
}
See the following topic for more information about grid spacing configuration: Grid Spacing.