Lesson 3 - Add Analytical Data to a Geographical Map
- 4 minutes to read
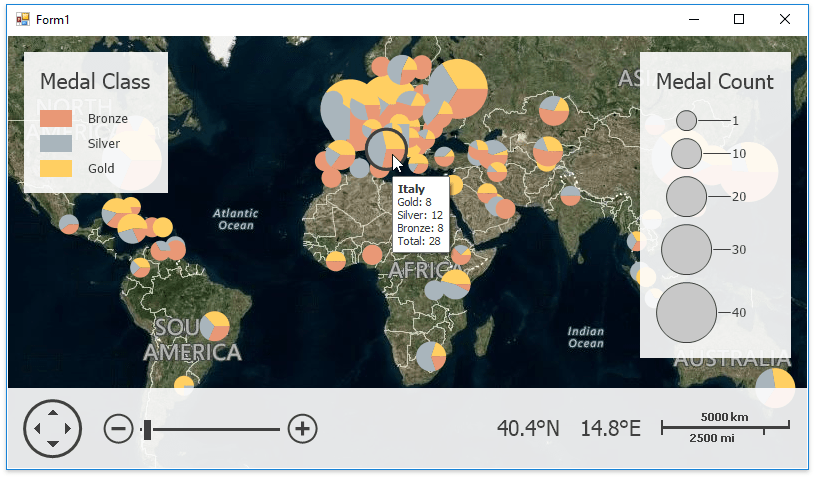
The Map control can visualize data bound to geographical coordinates from various data sources (a database, an XML file, a list of records, etc.). This tutorial describes the steps required to create Pie charts on the map surface using data stored in an external XML file. This XML data file contains Olympic Games medal information.
To bind a map control to an XML data source, follow the instructions below:
- Step 1. Add a Map Control
- Step 2. Prepare a Vector Items Layer and Load Data
- Step 3. Configure Pie Chart Items
- Step 4. Prepare a Colorizer
- Step 5. Add Legends
- Result
Step 1. Add a Map Control
- First, drop a MapControl onto the main form and connect the map to Azure Maps, as in Lesson 1.
- Then, drop a ToolTipController onto the main form and assign it to the MapControl.ToolTipController property. After that, set ToolTipController.AllowHtmlText to true.
Step 2. Prepare a Vector Items Layer and Load Data
Add an empty VectorItemsLayer to the Map’s MapControl.Layers collection as follows:
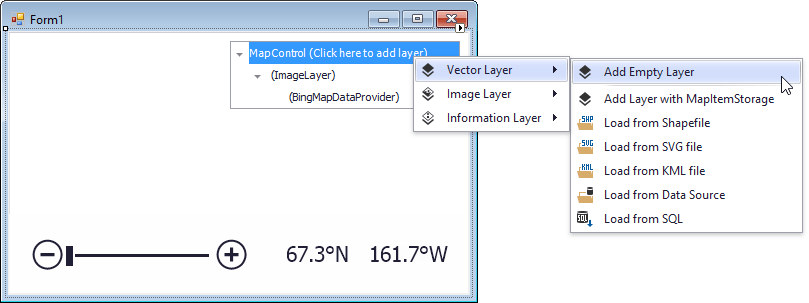
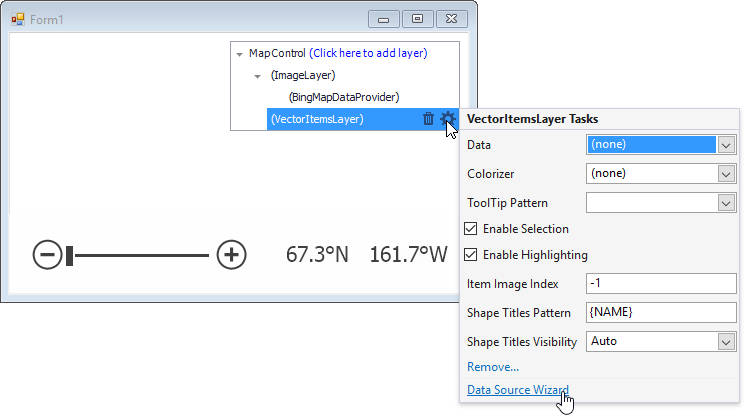
To bind a data source to this layer, run the Data Source Wizard, as shown in the following image:
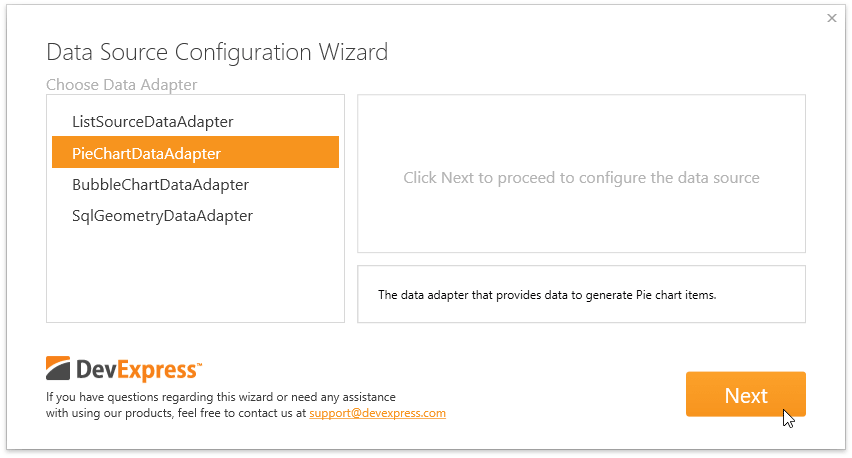
On the first Data Source Configuration Wizard page, set a data adapter as PieChartDataAdapter that allows the vector layer to generate Pie chart items. Then, click Next.
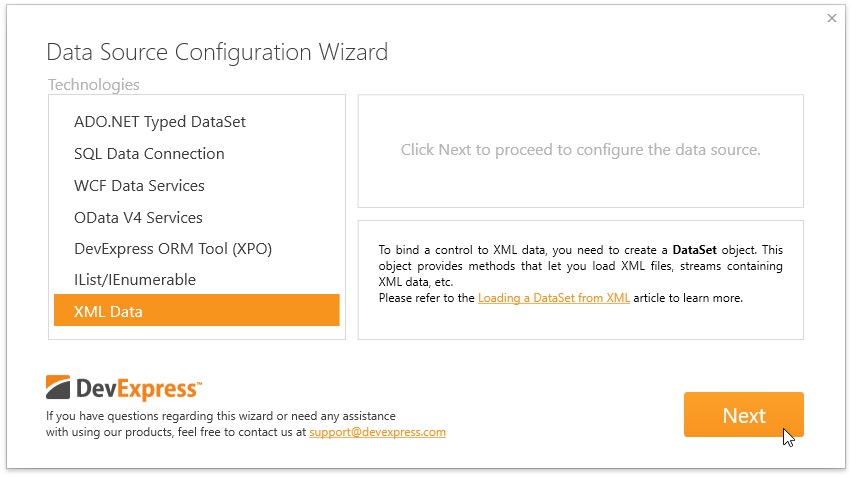
In the list of available technologies, select the XML Data item. Then, click Next.
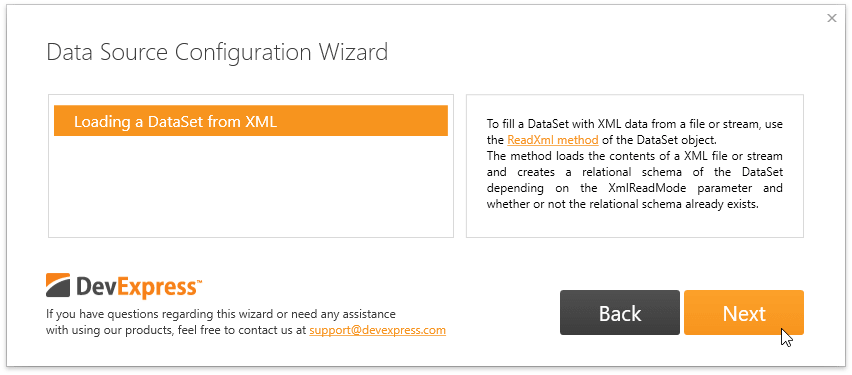
On the next page, select the Loading a DataSet from XML item. Then, click Next.
On the final Data Source Configuration Wizard page, do the following:
Click the Load Xml… button.
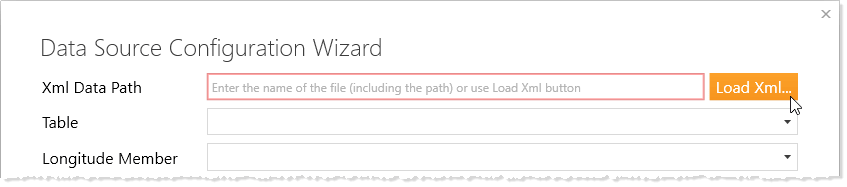
In the invoked window, browse the rio2016.xml data source file and click Open.
Note
The rio2016.xml file is shipped with DevExpress demos and stored in the C:\Users\Public\Documents\DevExpress Demos 17.1\Components\Data directory by default.
Define data source members used to generate Pie chart items on the map as follows:
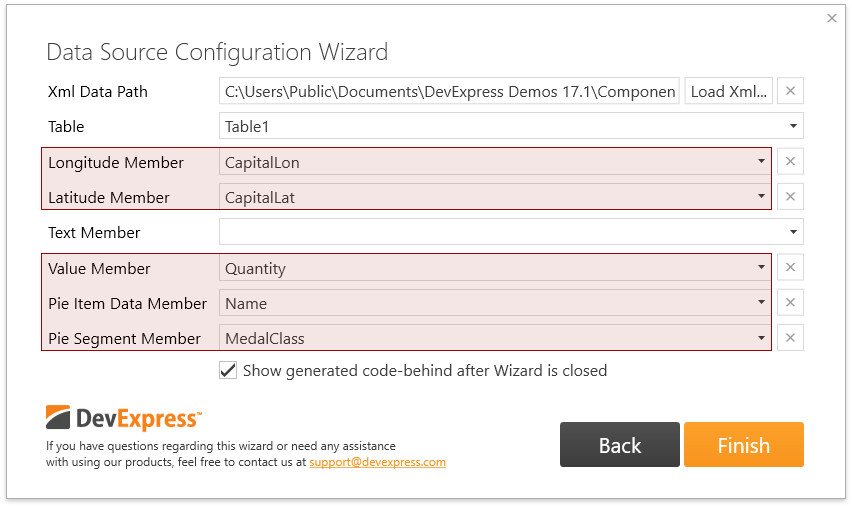
- Finally, click Finish to complete the data source configuration.
Step 3. Configure Pie Chart Items
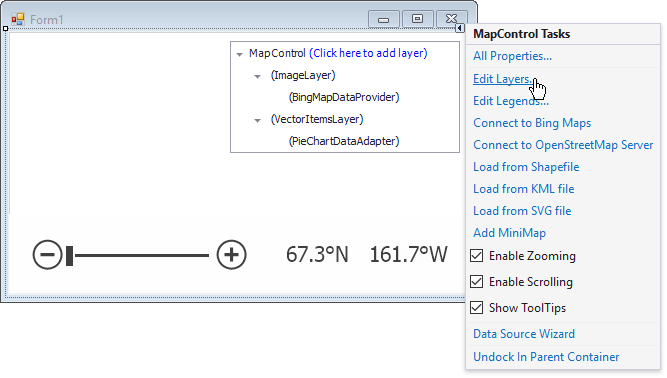
To create Pie chart items on the map surface, invoke the Map’s Layers Editor as shown below.
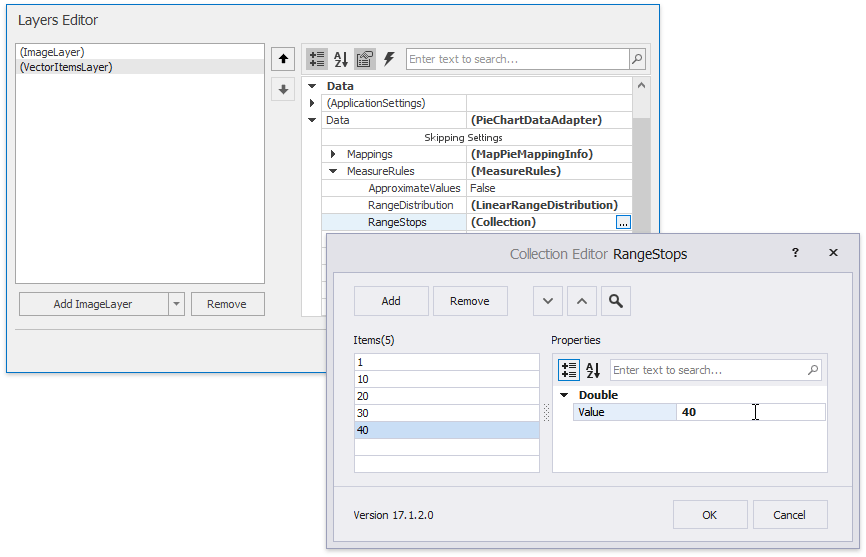
In the editor, customize the ChartDataSourceAdapter.MeasureRules property to specify how chart items are ranged by their values. To do this, assign a MeasureRules object to the property and specify the MeasureRules.RangeStops property of this object as shown below.
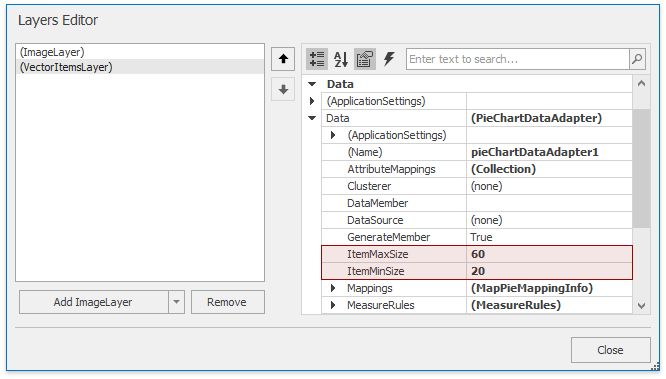
Modify the minimum and maximum sizes of pie charts. For this, set ChartDataSourceAdapter.ItemMinSize to 20 and ChartDataSourceAdapter.ItemMaxSize to 60.
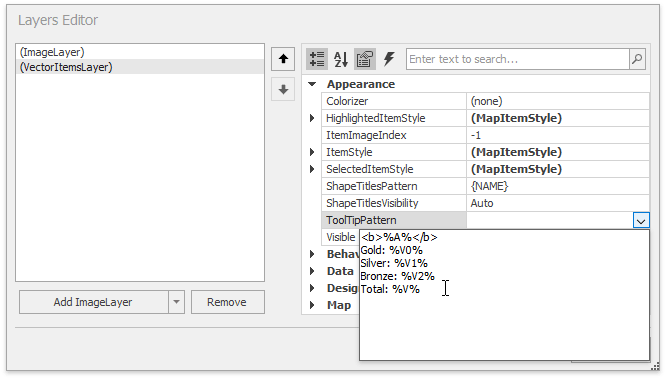
Specify the MapItemsLayerBase.ToolTipPattern property as follows:
<b>%A%</b>
Gold: %V0%
Silver: %V1%
Bronze: %V2%
Total: %V%
Finally, handle the layer’s LayerBase.DataLoaded event.
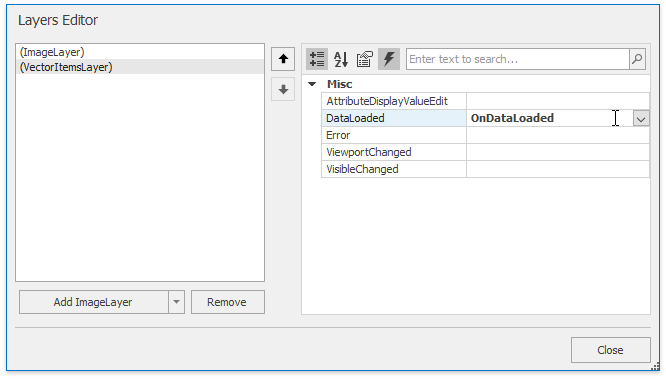
In the event handler, call the MapControl.ZoomToFitLayerItems method to adjust the Map Control’s center point and zoom level for the best item representation.
Step 4. Prepare a Colorizer
The next step is the Colorizer customization. For this, do the following:
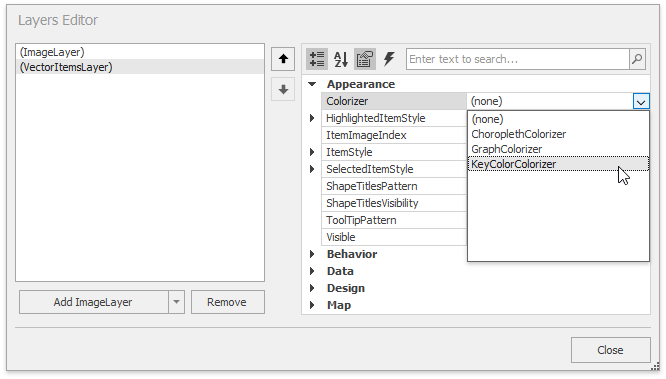
In the Layers Editor, assign a KeyColorColorizer object to the VectorItemsLayer.Colorizer property.
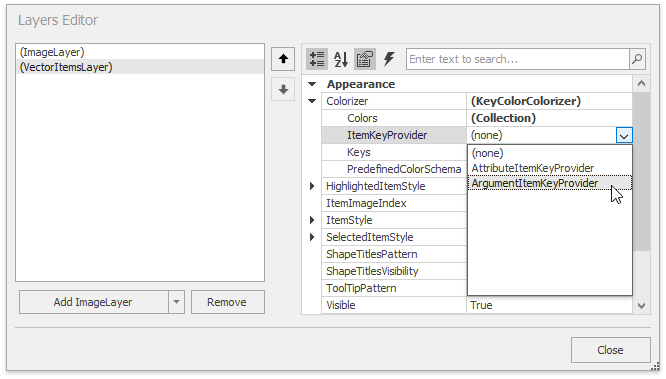
Specify the KeyColorColorizer.ItemKeyProvider property as ArgumentItemKeyProvider.
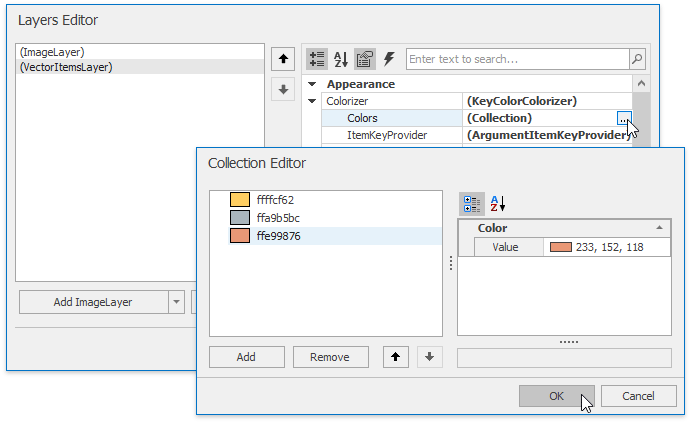
Add the following Color objects to the KeyColorColorizer.Colors collection:
- 255, 207, 98
- 169, 181, 188
- 233, 152, 118
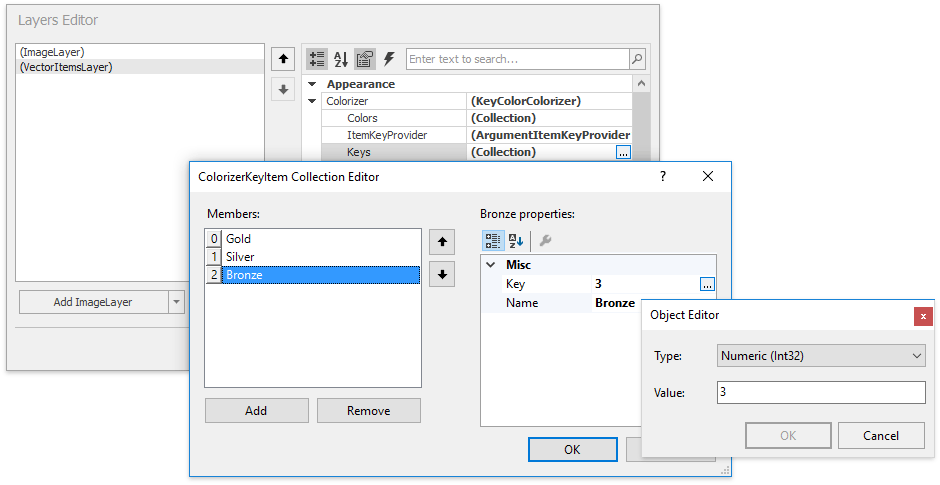
Add the following key-name pairs to the KeyColorColorizer.Keys collection. Note that the key type should be Int32.
- 1 - Gold
- 2 - Silver
- 3 - Bronze
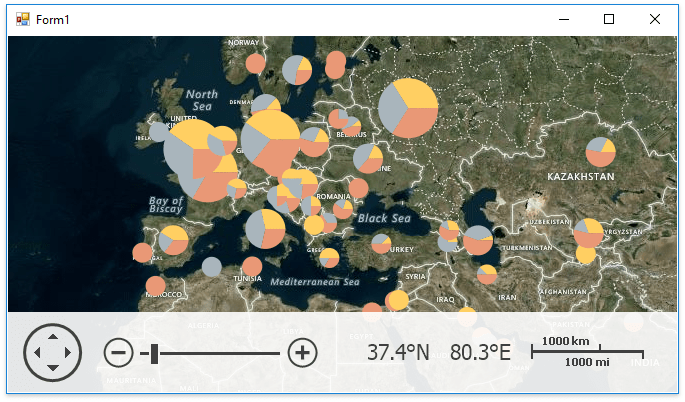
The application should look like this if it is launched now :
Step 5. Add Legends
To add legends to the application, do the following:
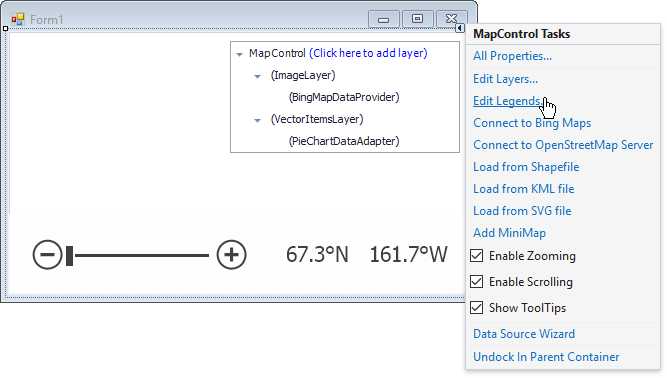
Click the Map control’s smart tag to invoke its Actions list. In the Actions list, click the Edit Legends… link.
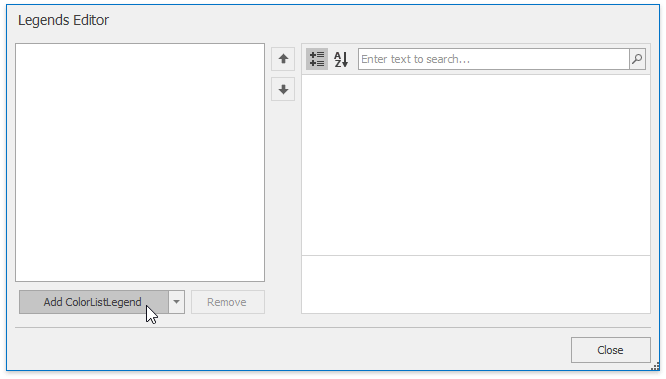
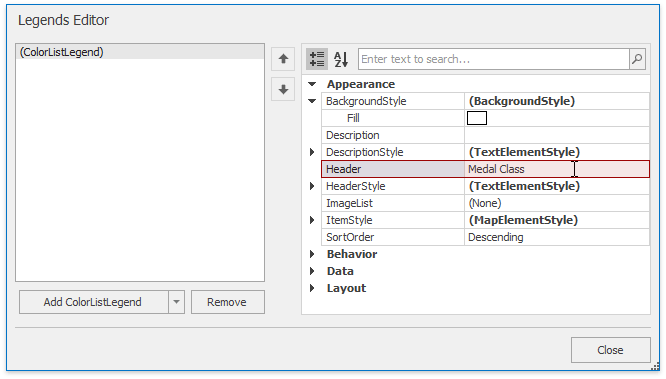
In the invoked Legends Editor, choose ColorListLegend and click the Add ColorListLegend button.
Set the MapLegendBase.Header property to Medal Class.
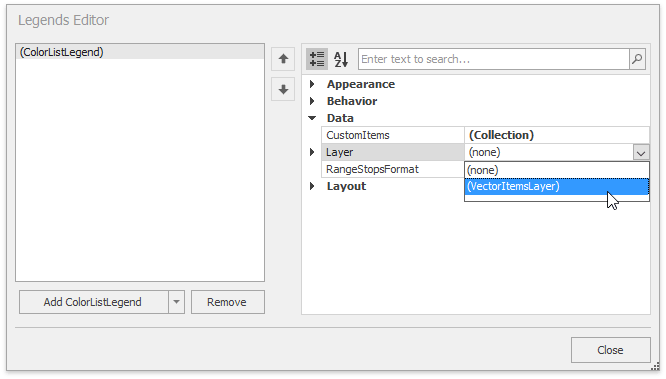
Set the ItemsLayerLegend.Layer property to the vector layer.
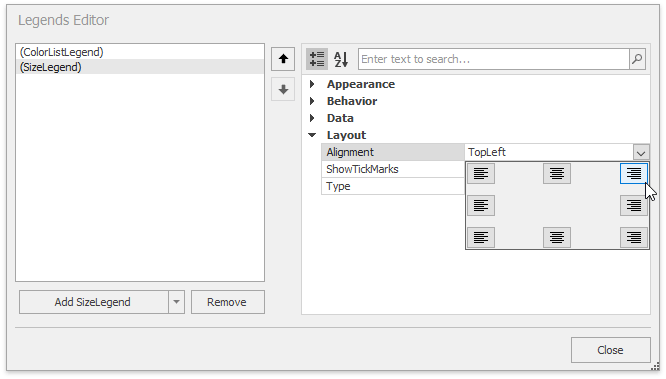
- Repeat the three previous steps to add a SizeLegend with the Medal Count as the MapLegendBase.Header property value.
Finally, set the MapLegendBase.Alignment property of the SizeLegend object to LegendAlignment.TopRight.
Result
Run the application to see the results.