Lesson 2 - Load a Vector Cartesian Map
- 3 minutes to read
This is the second tutorial in the Getting Started series for the Map control. It guides you through the process of creating a simple map application that uses Cartesian coordinates to display vector data.
The DevExpress Map control can display both Geographical and Cartesian maps. The Geographical maps usually use geographical coordinates (latitude and longitude) to show geospatial data, while Cartesian maps use X and Y coordinates to draw building plans or any other Cartesian data.
Step 1. Add a Map Control
Run Microsoft Visual Studio.
Create a new Windows Forms Application project and add the MapControl component to it. (See the first step in Lesson 1 to learn how to do this).
Step 2. Customize the Map Control
Follow the steps below to prepare the Map control to draw a Cartesian map and customize control settings:
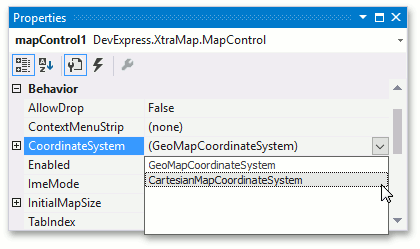
Set the MapControl.CoordinateSystem property value to CartesianMapCoordinateSystem.
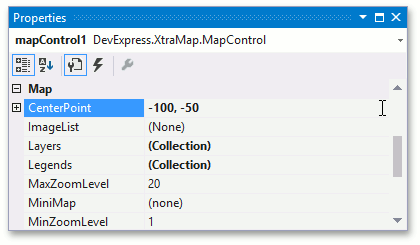
Specify the MapControl.CenterPoint property value as shown below.
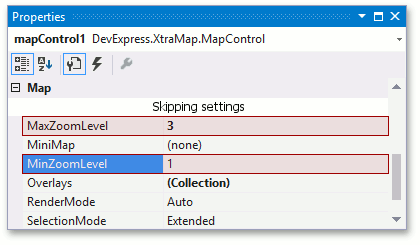
Set the MapControl.MaxZoomLevel property value to 3 and the MapControl.MinZoomLevel property value to 1.
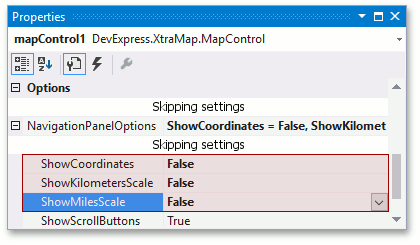
Set NavigationPanelOptions.ShowCoordinates, NavigationPanelOptions.ShowKilometersScale and NavigationPanelOptions.ShowMilesScale property values to false.
Step 3. Load Vector Data
To add a vector layer and bind it to data, do the following:
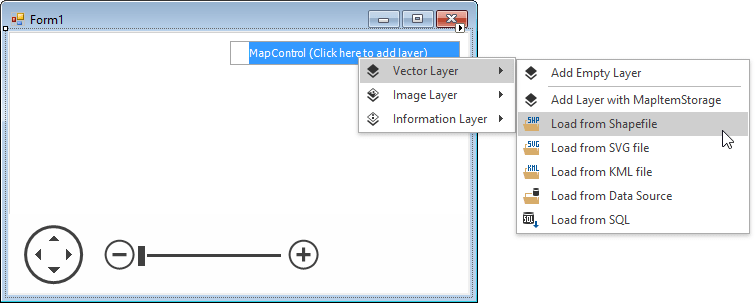
- Select the Click here to add layer link on the map control surface.
In the invoked list, select the Vector Layer | Load from Shapefile item.
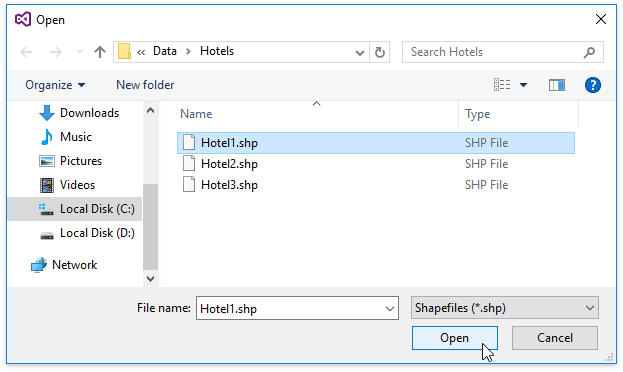
In the Open dialog, locate the C:\Users\Public\Documents\DevExpress Demos 26.1\Components\Data\Hotels\Hotel1.shp file and click Open.
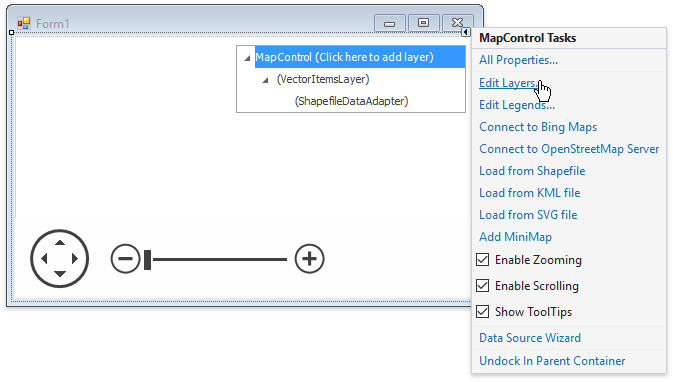
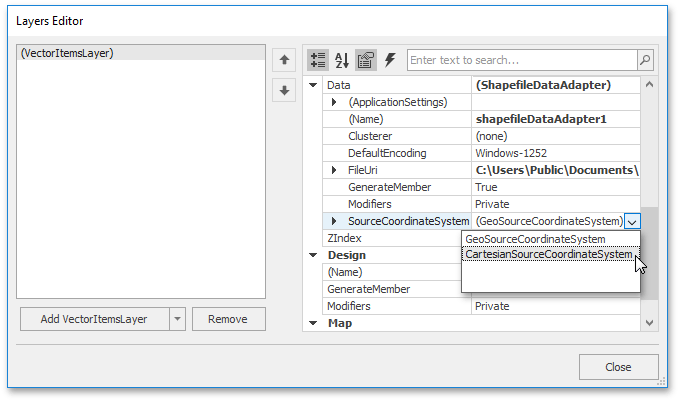
Then, run the Layers Editor as shown below.
In the editor, set the CoordinateSystemDataAdapterBase.SourceCoordinateSystem property value to CartesianSourceCoordinateSystem.
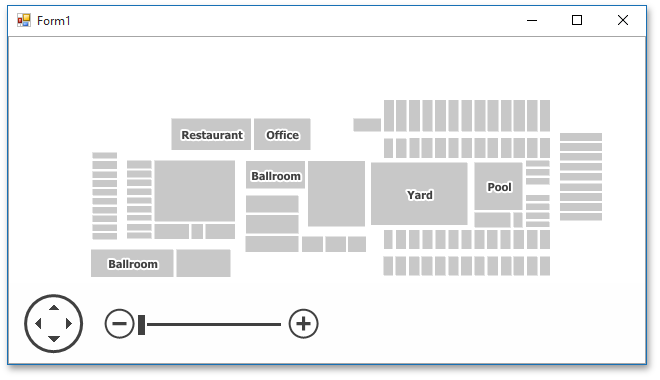
Close the editor and run the application. It should look as follows:
Step 4. Customize a Colorizer
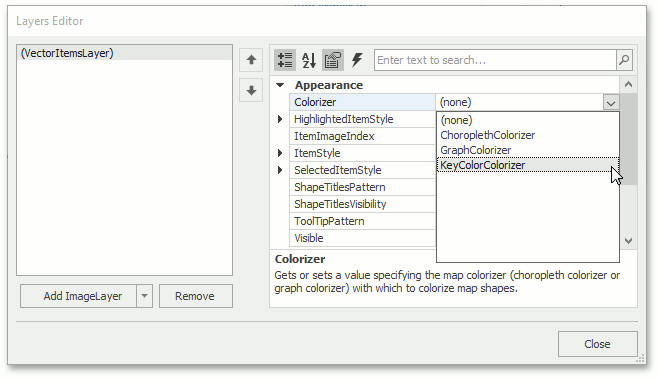
To configure a colorizer, run the Layers Editor as you did in the previous step.
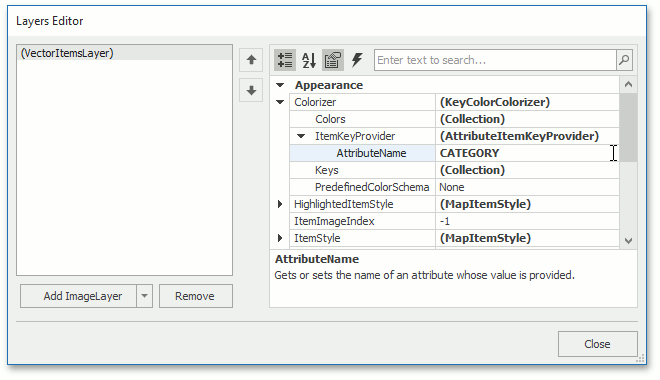
In the editor, assign the KeyColorColorizer as the VectorItemsLayer.Colorizer property value.
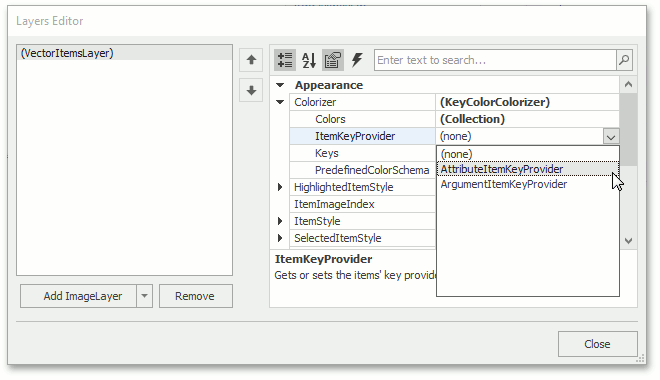
Set the KeyColorColorizer.ItemKeyProvider property value to AttributeItemKeyProvider.
Specify the NamedAttributeProviderBase.AttributeName property as shown below.
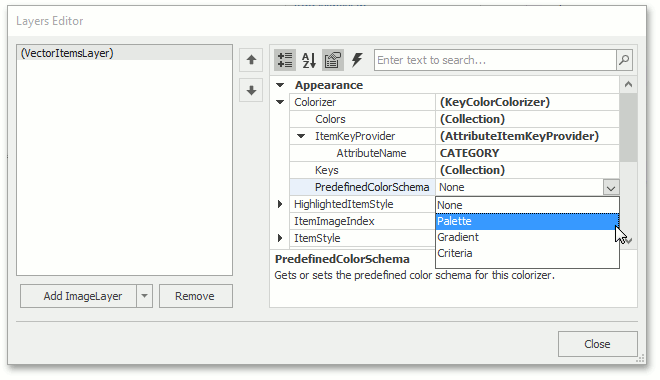
Set the PredefinedColorsColorizer.PredefinedColorSchema property value to PredefinedColorSchema.Palette.
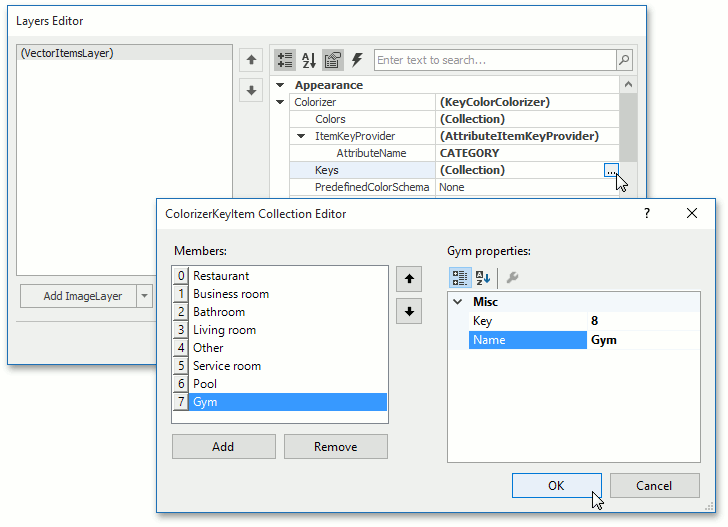
Add the following key-name pairs to the KeyColorColorizer.Keys property. Note that the key type should be Int32.
- 1 - Restaurant
- 2 - Business room
- 3 - Bathroom
- 4 - Living room
- 5 - Other
- 6 - Service room
- 7 - Pool
- 8 - Gym
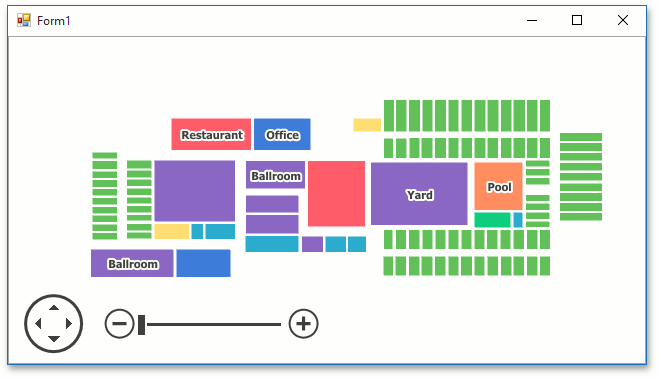
Run the application. It should look as follows:
Step 5. Customize a Legend
To add a legend to the Map control, do the following:
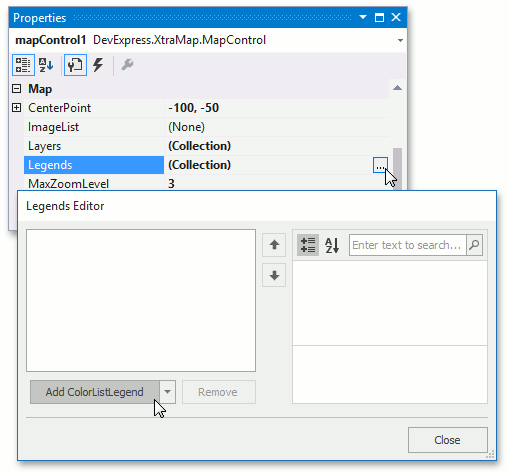
Locate the MapControl.Legends property in the Properties window and click the ellipsis button to invoke the Legends Editor. In the editor, select the ColorListLegend from the drop-down list and click the Add ColorListLegend button.
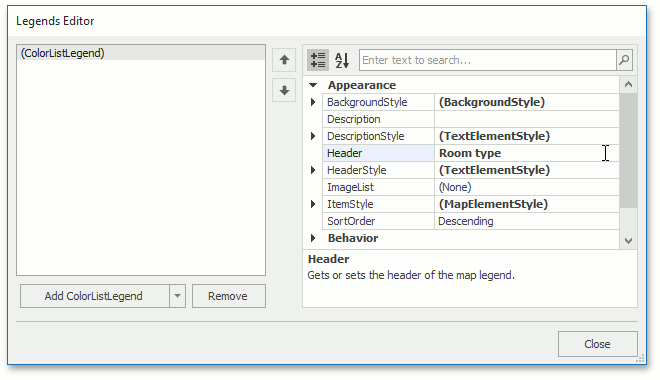
Set the MapLegendBase.Header property value to Room Type.
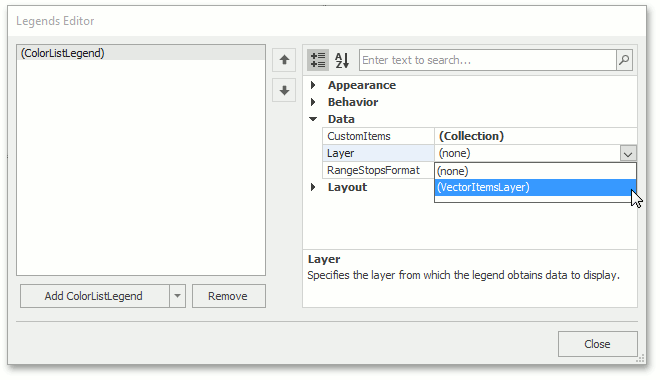
Finally, assign the customized vector layer as the ItemsLayerLegend.Layer property.
Results
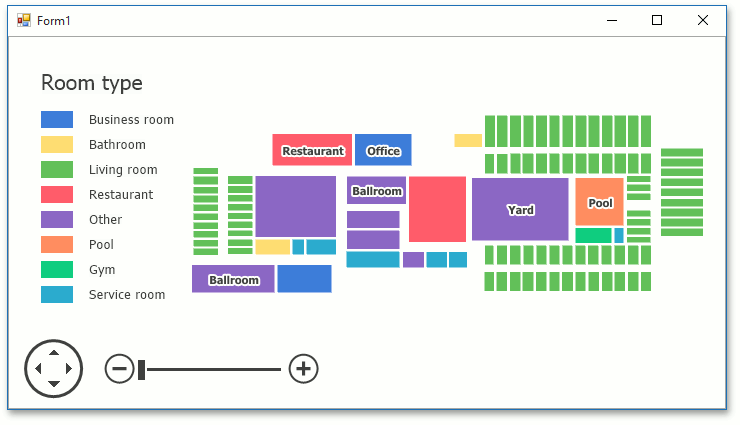
Run the application to see the results.
Next Steps
- Lesson 3 - Add Analytical Data to a Geographical Map
- This tutorial describes how to display pie charts over a geographical map.
- Provide Cartesian Data to a Geographical Map
- Show data in Cartesian coordinates on a geographical map.
- Colorizers
- Use colorizers to paint vector shapes based on a criterion.
- Legends
- Add a legend to distinguish vector shapes on the map.