Integrate the WinForms Chart with the Range Control
- 5 minutes to read
Tip
You can use DevExpress BI Dashboard to build data visualization and analysis UIs that include Charts, Grids, Maps, Pivot Grids, Cards, Range Selectors, and other elements. This cross-platform product is available as a part of the DevExpress Universal Subscription.
Review the following help topic to learn the basics: Get Started with the DevExpress Dashboard.
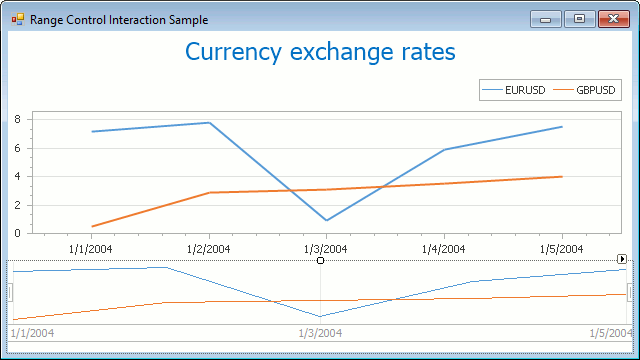
When you deal with a large amount of data, you can integrate XtraCharts for Windows Forms and a Range control in one application. These two controls allow you to track data changes, select a range of data, scroll, zoom in and out, and so on. As a result, you get an interactive tool that simplifies the comparison and analysis of different chart series.
For more information on the Range control, see the following section: Range Control.
Connect to a Range Control
To integrate controls, drag a RangeControl from the DX.25.2: Common Controls toolbox tab and drop it onto a form with a ChartControl. A Range control is automatically bound to a chart and allows you to see a chart series in the Range control’s Viewport.
To make sure binding succeeded, check the RangeControl.Client property: the value should be the Chart name (for example, chartControl1).
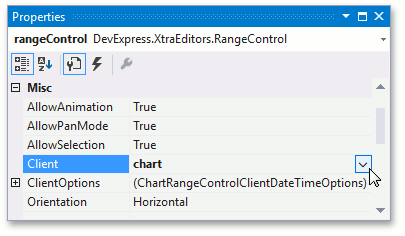
Chart and Range Customization
You can customize a display of the Chart control within the Range control. For this, access the RangeControlOptions object that contains properties that specify the series appearance in a Range control’s viewport.
Use the XYDiagram2DSeriesViewBase.RangeControlOptions to get access to the range control options for a series.
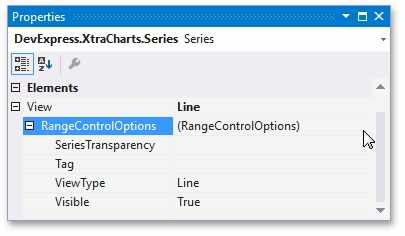
The following properties of the RangeControlOptions class affect the series appearance in a Range control:
- ViewType
- Gets or sets a value that specifies which view type (either Line or Area) should be used to represent an XYDiagram2D series in a Range Control.
- SeriesTransparency
- Gets or sets the transparency (0-255) to apply to a series displayed in a Range control.
- ValueLevel
- Specifies which level of data points should be used to represent a FinancialIndicator series in a Range Control.
- Visible
- Gets or sets a value indicating whether or not this series should be displayed in a Range Control.
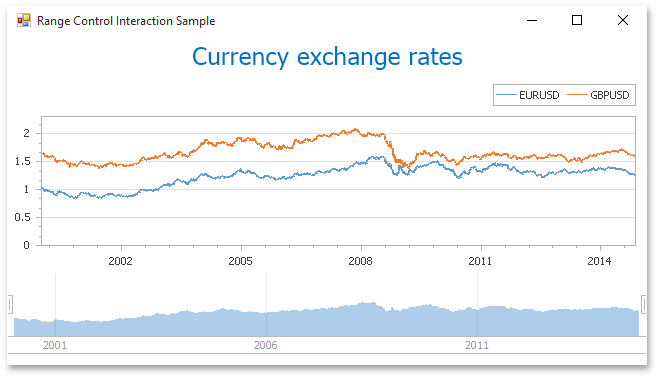
In the image below, the first Line series is hidden in the viewport (the RangeControlOptions.Visible property is set to false), while the second Line series is displayed as an Area (RangeControlOptions.ViewType is set to Area) in the Range control.
Interaction Capabilities
When you run your application, you can do the following:
- Select ranges (a chart adjusts axis ranges to the value that corresponds to the interval you selected)
- Use animated range selection
- Zoom in and out
- Use the touch screen
For additional information on chart interaction, refer to the End-User Capabilities section.
Examples
This example demonstrates how the grid lines and grid snapping of the chart within the range control’s viewport can be customized at runtime.
To access the client options of the chart inside the range control’s viewport, use the RangeControl.ClientOptions property. In this example, the chart control contains data with date-time arguments, so this property returns an object of the ChartRangeControlClientDateTimeOptions type.
To access the grid properties (e.g., ChartRangeControlClientGridOptions.SnapSpacing, ChartRangeControlClientDateTimeGridOptions.SnapAlignment, ChartRangeControlClientGridOptions.GridSpacing and ChartRangeControlClientDateTimeGridOptions.GridAlignment) of the chart range control client, access the ChartRangeControlClientDateTimeGridOptions object using the ChartRangeControlClientDateTimeOptions.RangeControlDateTimeGridOptions property.
using System;
using System.Windows.Forms;
using DevExpress.XtraCharts;

namespace DateTimeChartRangeControlClient {
    public partial class Form1 : Form {

        const int daysForYear = 30;

        public Form1() {
            InitializeComponent();

            // Call the InitializeChart method.
            InitializeChart();

            // Specify a Chart control as the Range control client.
            rangeControl1.Client = chartControl1;

            // Access the date-time grid options of the chart range control client.
            var clientOptions = (ChartRangeControlClientDateTimeOptions)rangeControl1.ClientOptions;
            ChartRangeControlClientDateTimeGridOptions gridOptions = clientOptions.RangeControlDateTimeGridOptions;

            // Specify the manual grid mode of the chart range control client.
            gridOptions.GridMode = ChartRangeControlClientGridMode.Manual;

            // Customize snap and grid properties of the chart range control client.
            gridOptions.SnapOffset = 2;
            gridOptions.SnapSpacing = 7;
            gridOptions.SnapAlignment = DateTimeGridAlignment.Day;
            gridOptions.GridSpacing = 7;
            gridOptions.GridAlignment = DateTimeGridAlignment.Day;
            gridOptions.GridOffset = 1;

            // Format labels of the chart range control client.
            gridOptions.LabelFormat = "D";
        }

        void InitializeChart() {

            DateTime baseDate = new DateTime(2000, 1, 1);
            Random rnd = new Random();
            Series series = new Series("Series", ViewType.Bar);

            for (int dayCount = 0; dayCount < daysForYear; dayCount++) {
                DateTime argument = baseDate.AddDays(dayCount);
                double value = rnd.Next(50, 100);
                var seriesPoint = new SeriesPoint(argument, value);
                series.Points.Add(seriesPoint);
            }
            chartControl1.Series.Add(series);
        }
    }
}