Variation Types
- 3 minutes to read
Variation summary display types are designed to display absolute and percentage difference between the current value and the previously calculated value for the field. To employ variation summary display types, use DifferenceBinding in Optimized mode.
Note
You can hide the first (empty) column/row that displays variation data for the current data field. For this, set the PivotGridFieldOptions.HideEmptyVariationItems property to true.
The following variation types are available:
Absolute Variation
The absolute variance between the current value and the previously calculated value for the current field is displayed in a cell.
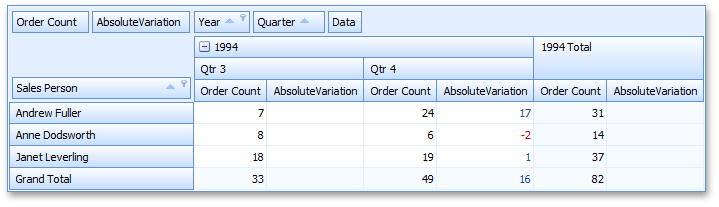
For instance, the Andrew Fuller – Quarter 4 – AbsoluteVariation cell value is calculated as follows:
17 = 24 - 7
24 is the actual sum calculated against the Order Count field for Andrew Fuller – Quarter 4, and 7 is the previous summary value (Andrew Fuller – Quarter 3).
Example
The following code snippet shows how to calculate the absolute variances for the Number field cells:
void ItemClick(object sender, EventArgs e) {
// ...
    PivotGridField field = item.Tag as PivotGridField;
    DataSourceColumnBinding sourceBinding = new DataSourceColumnBinding("Number");
    PivotSummaryDisplayType newValue = (PivotSummaryDisplayType)Enum.Parse(typeof(PivotSummaryDisplayType),
       item.Caption);
    switch(newValue) {
    // ...
       case PivotSummaryDisplayType.AbsoluteVariation:
           field.DataBinding = new DifferenceBinding(
               sourceBinding,
               CalculationPartitioningCriteria.RowValue,
               CalculationDirection.DownThenAcross,
               DifferenceTarget.Previous,
               DifferenceType.Absolute);
           break;
    // ...
    }
    field.Tag = newValue;
}
Note
Set PivotGridFieldBase.SummaryDisplayType to AbsoluteVariation in Legacy, LegacyOptimized, and OLAP modes.
Percent Variation
The percentage variance between the current value and the previously calculated value for the current field is displayed in a cell.
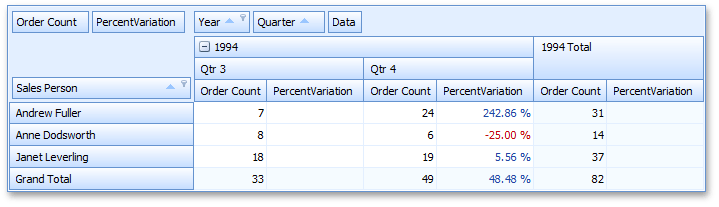
For instance, the Andrew Fuller – Quarter 4 – PercentVariation cell value is calculated as follows:
2.4286 = (24-7)/7
To specify formatting settings, use the data field’s PivotGridFieldBase.CellFormat property.
Example
The following code snippet shows how to calculate the percent variances for the Number field cells:
void ItemClick(object sender, EventArgs e) {
// ...
    PivotGridField field = item.Tag as PivotGridField;
    DataSourceColumnBinding sourceBinding = new DataSourceColumnBinding("Number");
    PivotSummaryDisplayType newValue = (PivotSummaryDisplayType)Enum.Parse(typeof(PivotSummaryDisplayType),
       item.Caption);
    switch(newValue) {
    // ...
       case PivotSummaryDisplayType.PercentVariation:
           field.DataBinding = new DifferenceBinding(
               sourceBinding,
               CalculationPartitioningCriteria.RowValue,
               CalculationDirection.DownThenAcross,
               DifferenceTarget.Previous,
               DifferenceType.Percentage);
           break;
    // ...
    }
    field.Tag = newValue;
}
Note
Set PivotGridFieldBase.SummaryDisplayType to PercentVariation in Legacy, LegacyOptimized, and OLAP modes.