ChartOptions.DisplayBlanksAs Property
Gets or sets how the chart displays blank values.
Namespace: DevExpress.Docs.Office
Assembly: DevExpress.Docs.Core.v26.1.dll
NuGet Package: DevExpress.Docs.Core
Declaration
Property Value
| Type | Description |
|---|---|
| DisplayBlanksAsType | Specifies how the chart displays blank values. The default value is |
Available values:
| Name | Description | Image |
|---|---|---|
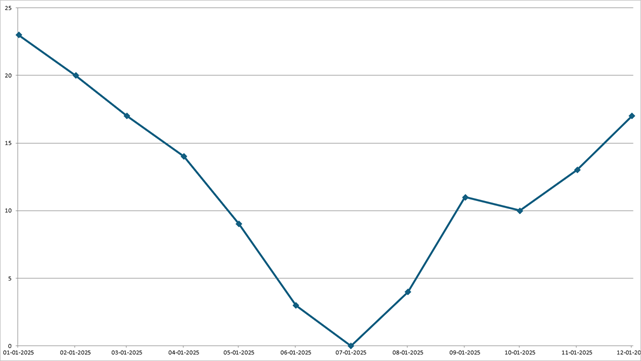
| Zero | Specifies that empty cells should be treated as zeros. |
|
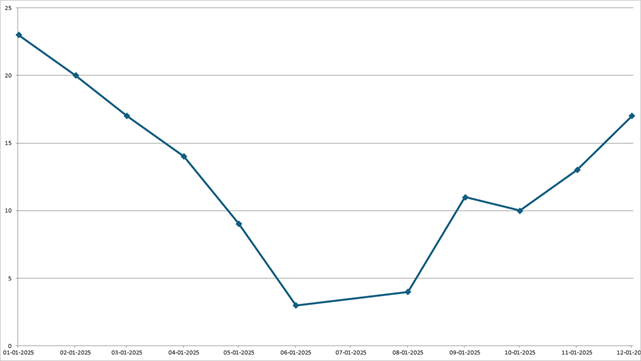
| Span | Specifies that empty cells should be spanned with a line. |
|
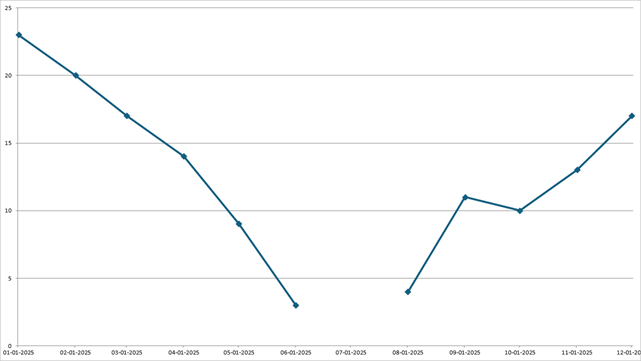
| Gap | Specifies that empty cells should be displayed as gaps on a chart. |
|
Property Paths
You can access this nested property as listed below:
| Object Type | Path to DisplayBlanksAs |
|---|---|
| Chart |
|
Remarks
Use the DisplayBlanksAs property to specify how empty cells are plotted in a line, area, scatter, or radar chart.
The following image shows how a chart can display blank values:

using DevExpress.Docs.Office;
using DevExpress.Docs.Presentation;
using System.Drawing;

namespace PresentationApiSample;
public class Program {
    public static async Task Main(string[] _) {
        // Create a presentation.
        Presentation presentation = new Presentation();

        // Reset the slide collection.
        presentation.Slides.Clear();

        // Add a blank slide.
        Slide slide = new Slide(SlideLayoutType.Blank);
        presentation.Slides.Add(slide);

        // Insert a chart on the slide.
        Chart chart = new Chart();
        slide.Shapes.Add(chart);

        // Set chart size to match the slide.
        chart.Width = presentation.SlideSize.Width;
        chart.Height = presentation.SlideSize.Height;

        // Populate numeric values and leave one point blank.
        chart.Data[0, "A1"].NumericValue = 23;
        chart.Data[0, "A2"].NumericValue = 20;
        chart.Data[0, "A3"].NumericValue = 17;
        chart.Data[0, "A4"].NumericValue = 14;
        chart.Data[0, "A5"].NumericValue = 9;
        chart.Data[0, "A6"].NumericValue = 3;
        //chart.Data[0, "A7"].NumericValue = 0;
        chart.Data[0, "A8"].NumericValue = 4;
        chart.Data[0, "A9"].NumericValue = 11;
        chart.Data[0, "A10"].NumericValue = 10;
        chart.Data[0, "A11"].NumericValue = 13;
        chart.Data[0, "A12"].NumericValue = 17;

        // Populate date values for the argument axis.
        chart.Data[0, "B1"].DateTimeValue = new DateTime(2025, 1, 1);
        chart.Data[0, "B2"].DateTimeValue = new DateTime(2025, 2, 1);
        chart.Data[0, "B3"].DateTimeValue = new DateTime(2025, 3, 1);
        chart.Data[0, "B4"].DateTimeValue = new DateTime(2025, 4, 1);
        chart.Data[0, "B5"].DateTimeValue = new DateTime(2025, 5, 1);
        chart.Data[0, "B6"].DateTimeValue = new DateTime(2025, 6, 1);
        chart.Data[0, "B7"].DateTimeValue = new DateTime(2025, 7, 1);
        chart.Data[0, "B8"].DateTimeValue = new DateTime(2025, 8, 1);
        chart.Data[0, "B9"].DateTimeValue = new DateTime(2025, 9, 1);
        chart.Data[0, "B10"].DateTimeValue = new DateTime(2025, 10, 1);
        chart.Data[0, "B11"].DateTimeValue = new DateTime(2025, 11, 1);
        chart.Data[0, "B12"].DateTimeValue = new DateTime(2025, 12, 1);

        // Create a line series and bind it to worksheet ranges.
        LineSeries series = new LineSeries();
        series.Arguments = new ChartDataReference("B1", "B12");
        series.Values = new ChartDataReference("A1", "A12");
        chart.Series.Add(series);

        // Disable line smoothing.
        series.Smooth = false;

        // Display blank values as zeros.
        chart.Options.DisplayBlanksAs = DisplayBlanksAsType.Zero;

        // Configure the date axis to use months.
        DateAxis axisx = chart.ArgumentAxis as DateAxis;
        axisx.MajorTimeUnit = AxisTimeUnitType.Months;

        // Hide the chart legend.
        chart.Legend = null;

        // Save the result to a file.
        var outputPath = @"D:\presentation.pptx";
        using FileStream outputStream = new(outputPath, FileMode.Create, FileAccess.Write, FileShare.None);
        presentation.SaveDocument(outputStream);
    }
}
See Also