StockChartView Class
A view that displays stock charts.
Namespace: DevExpress.Docs.Office
Assembly: DevExpress.Docs.Core.v26.1.dll
NuGet Package: DevExpress.Docs.Core
Declaration
Remarks
For additional information, refer to the following help topic: Series and Views.
Example
The following example creates an Open-High-Low-Close stock chart with data labels. Add four series to the chart in the following order: Open, High, Low, and Close.
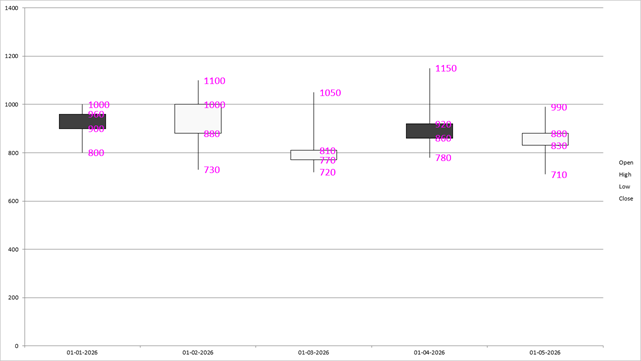
using DevExpress.Docs.Office;
using DevExpress.Docs.Presentation;
using System.Drawing;
using System.IO;

namespace PresentationApiSample;
public class Program {
    public static void Main(string[] _) {
        // Create a presentation.
        Presentation presentation = new Presentation();

        // Reset the slide collection.
        presentation.Slides.Clear();

        // Add a blank slide.
        Slide slide = new Slide(SlideLayoutType.Blank);
        presentation.Slides.Add(slide);

        // Insert a chart on the slide.
        Chart chart = new Chart();
        slide.Shapes.Add(chart);

        // Set chart size to match the slide.
        chart.Width = presentation.SlideSize.Width;
        chart.Height = presentation.SlideSize.Height;

        // Populate argument values.
        chart.Data[0, "A1"].DateTimeValue = new DateTime(2026, 1, 1);
        chart.Data[0, "A2"].DateTimeValue = new DateTime(2026, 1, 2);
        chart.Data[0, "A3"].DateTimeValue = new DateTime(2026, 1, 3);
        chart.Data[0, "A4"].DateTimeValue = new DateTime(2026, 1, 4);
        chart.Data[0, "A5"].DateTimeValue = new DateTime(2026, 1, 5);

        // Populate high values.
        chart.Data[0, "B1"].NumericValue = 1000;
        chart.Data[0, "B2"].NumericValue = 1100;
        chart.Data[0, "B3"].NumericValue = 1050;
        chart.Data[0, "B4"].NumericValue = 1150;
        chart.Data[0, "B5"].NumericValue = 990;

        // Populate low values.
        chart.Data[0, "C1"].NumericValue = 800;
        chart.Data[0, "C2"].NumericValue = 730;
        chart.Data[0, "C3"].NumericValue = 720;
        chart.Data[0, "C4"].NumericValue = 780;
        chart.Data[0, "C5"].NumericValue = 710;

        // Populate close values.
        chart.Data[0, "D1"].NumericValue = 900;
        chart.Data[0, "D2"].NumericValue = 1000;
        chart.Data[0, "D3"].NumericValue = 810;
        chart.Data[0, "D4"].NumericValue = 860;
        chart.Data[0, "D5"].NumericValue = 880;

        // Populate open values.
        chart.Data[0, "E1"].NumericValue = 960;
        chart.Data[0, "E2"].NumericValue = 880;
        chart.Data[0, "E3"].NumericValue = 770;
        chart.Data[0, "E4"].NumericValue = 920;
        chart.Data[0, "E5"].NumericValue = 830;

        // Add the Open series.
        StockSeries seriesOpen = new StockSeries();
        chart.Series.Add(seriesOpen);
        seriesOpen.Text = "Open";
        seriesOpen.Arguments = new ChartDataReference("A1", "A5");
        seriesOpen.Values = new ChartDataReference("E1", "E5");
        seriesOpen.Properties = new ChartElement { OutlineStyle = new OutlineStyle { Fill = new NoFill() } };
        seriesOpen.Marker = new Marker { Symbol = MarkerStyle.None };

        // Add the High series.
        StockSeries seriesHigh = new StockSeries();
        chart.Series.Add(seriesHigh);
        seriesHigh.Text = "High";
        seriesHigh.Arguments = new ChartDataReference("A1", "A5");
        seriesHigh.Values = new ChartDataReference("B1", "B5");
        seriesHigh.Properties = new ChartElement { OutlineStyle = new OutlineStyle { Fill = new NoFill() } };
        seriesHigh.Marker = new Marker { Symbol = MarkerStyle.None };

        // Add the Low series.
        StockSeries seriesLow = new StockSeries();
        chart.Series.Add(seriesLow);
        seriesLow.Text = "Low";
        seriesLow.Arguments = new ChartDataReference("A1", "A5");
        seriesLow.Values = new ChartDataReference("C1", "C5");
        seriesLow.Properties = new ChartElement { OutlineStyle = new OutlineStyle { Fill = new NoFill() } };
        seriesLow.Marker = new Marker { Symbol = MarkerStyle.None };

        // Add the Close series.
        StockSeries seriesClose = new StockSeries();
        chart.Series.Add(seriesClose);
        seriesClose.Text = "Close";
        seriesClose.Arguments = new ChartDataReference("A1", "A5");
        seriesClose.Values = new ChartDataReference("D1", "D5");
        seriesClose.Properties = new ChartElement { OutlineStyle = new OutlineStyle { Fill = new NoFill() } };
        seriesClose.Marker = new Marker { Symbol = MarkerStyle.None };

        // Configure stock chart view options.
        StockChartView view = chart.Views[0] as StockChartView;
        view.ShowHighLowLines = true;
        view.ShowUpDownBars = true;
        view.ShowDropLines = false;

        // Configure data labels.
        view.DataLabels.ShowValue = true;
        view.DataLabels.LabelPosition = StockDataLabelPosition.Right;
        view.DataLabels.TextProperties = new TextProperties { Fill = new SolidFill(Color.Magenta), FontSize = 16 };

        // Save the presentation.
        var outputPath = @"D:\presentation.pptx";
        using FileStream outputStream = new(outputPath, FileMode.Create, FileAccess.Write, FileShare.None);
        presentation.SaveDocument(outputStream);
    }
}
Implements
Inheritance
Object
OfficeObject
ChartViewBase
ChartViewWithDataLabels
StockChartView
See Also