AreaSeriesBase Class
The base class for area series in a Chart.
Namespace: DevExpress.Docs.Office
Assembly: DevExpress.Docs.Core.v26.1.dll
Declaration
Example
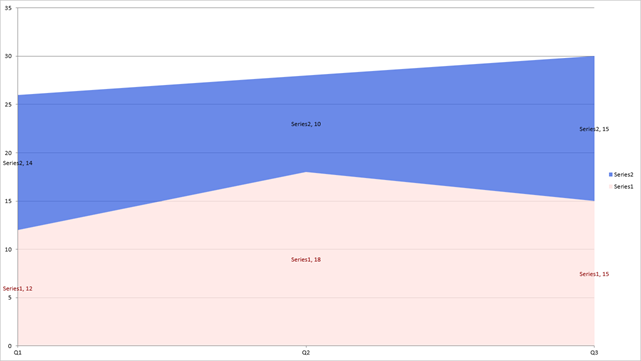
The following code snippet adds two area series to a presentation chart and customizes their view:
using DevExpress.Docs.Office;
using DevExpress.Docs.Presentation;
using System.Drawing;

namespace PresentationApiSample;

public class Program {
    public static async Task Main(string[] _) {

        Presentation presentation = new Presentation();

        presentation.Slides.Clear();

        Slide slide = new Slide(SlideLayoutType.Blank);
        presentation.Slides.Add(slide);

        // Insert a chart that fills the slide.
        Chart chart = new Chart();
        chart.Width = presentation.SlideSize.Width;
        chart.Height = presentation.SlideSize.Height;
        slide.Shapes.Add(chart);

        // Add the first area series.
        AreaSeries series1 = new AreaSeries();
        series1.Arguments = new ChartStringData(new[] { "Q1", "Q2", "Q3" });
        series1.Values = new ChartNumericData(new double[] { 12, 18, 15 });
        chart.Series.Add(series1);

        // Set fill and labels for the first series.
        series1.Properties = new ChartElement { Fill = new SolidFill(Color.FromArgb(200, Color.MistyRose)) };
        series1.DataLabels.ShowValue = true;
        series1.DataLabels.ShowSeriesText = true;
        series1.DataLabels.TextProperties = new TextProperties { Fill = new SolidFill(Color.DarkRed) };

        // Add the second area series.
        AreaSeries series2 = new AreaSeries();
        series2.Arguments = new ChartStringData(new[] { "Q1", "Q2", "Q3" });
        series2.Values = new ChartNumericData(new double[] { 14, 10, 15 });
        chart.Series.Add(series2);

        // Set fill and labels for the second series.
        series2.Properties = new ChartElement { Fill = new SolidFill(Color.FromArgb(200, Color.RoyalBlue)) };
        series2.DataLabels.ShowValue = true;
        series2.DataLabels.ShowSeriesText = true;
        series2.DataLabels.TextProperties = new TextProperties { Fill = new SolidFill(Color.Black) };

        // Access the chart view and specify the grouping mode for area series.
        AreaChartView view = (AreaChartView)chart.Views[0];
        view.Grouping = ChartGrouping.Stacked;

        // Save the presentation to a file or export it.
        // ...
    }
}
Implements
Inheritance
See Also