HistogramSeries Class
Displays data as a histogram chart.
Namespace: DevExpress.Docs.Office
Assembly: DevExpress.Docs.Core.v26.1.dll
NuGet Package: DevExpress.Docs.Core
Declaration
Related API Members
The following members return HistogramSeries objects:
Remarks
The following code snippet creates a histogram series and adds it to a chart:
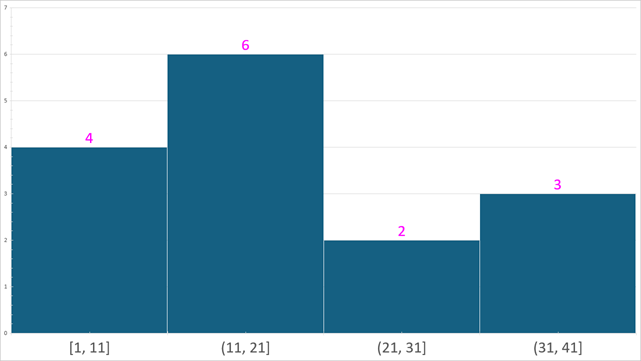
using DevExpress.Docs.Office;
using DevExpress.Docs.Presentation;

using System.Drawing;
namespace PresentationApiSample;

public class Program {
    public static async Task Main(string[] _) {
        // Create a presentation.
        Presentation presentation = new Presentation();

        // Reset the slide collection.
        presentation.Slides.Clear();

        // Add a blank slide.
        Slide slide = new Slide(SlideLayoutType.Blank);
        presentation.Slides.Add(slide);

        // Insert a chart on the slide.
        ChartEx chart = new ChartEx();
        slide.Shapes.Add(chart);

        // Set chart size to match the slide.
        chart.Width = presentation.SlideSize.Width;
        chart.Height = presentation.SlideSize.Height;

        // Create a histogram series and assign values.
        HistogramSeries series = new HistogramSeries();
        series.Values = new ChartNumericData(new double[] { 1, 2, 3, 2, 13, 12, 19, 34, 22, 21, 34, 30, 18, 16, 33});

        // Configure histogram bins.
        series.BinType = HistogramBinType.BinSize;
        series.BinSize = 10;

        // Add the series to the chart.
        chart.Series.Add(series);

        // Display and format data labels.
        series.DataLabels.ShowValue = true;
        series.DataLabels.TextProperties = new TextProperties { FontSize = 24, Fill = new SolidFill(Color.Magenta) };

        // Set argument axis label formatting.
        CategoryAxisEx? xAxis = chart.ArgumentAxis;
        if (xAxis != null) {
            xAxis.LabelTextProperties = new TextProperties { FontSize = 24 };
        }

        // Hide the chart legend.
        chart.Legend = null;

        // Save the result to a file.
        var outputPath = @"D:\presentation.pptx";
        using FileStream outputStream = new(outputPath, FileMode.Create, FileAccess.Write, FileShare.None);
        presentation.SaveDocument(outputStream);
    }
}
Implements
Inheritance
Object
OfficeObject
SeriesExBase
DataSeriesExBase
HistogramSeries
See Also