TreemapSeries Class
A treemap series for the ChartEx.
Namespace: DevExpress.Docs.Office
Assembly: DevExpress.Docs.Core.v26.1.dll
NuGet Package: DevExpress.Docs.Core
Declaration
Related API Members
The following members return TreemapSeries objects:
Remarks
The following code snippet adds a treemap chart to a slide and saves the result to a file:
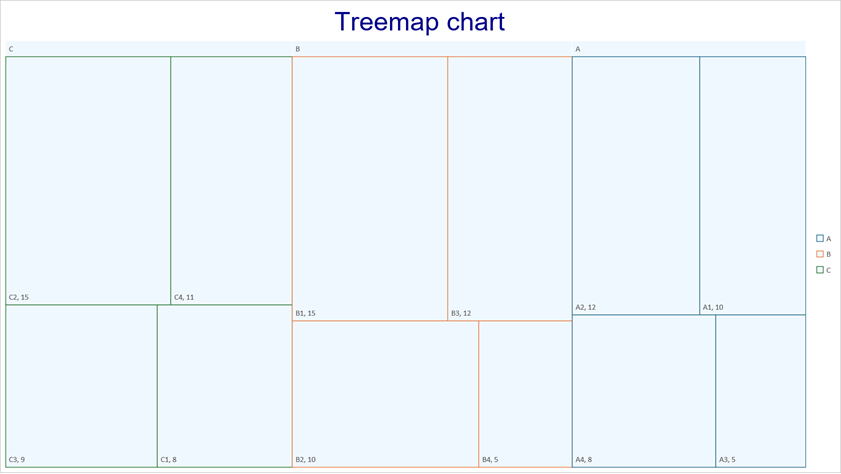
using DevExpress.Docs.Office;
using DevExpress.Docs.Presentation;
using System.Drawing;

namespace PresentationApiSample;
public class Program {
    public static async Task Main(string[] _) {
        // Create a presentation.
        Presentation presentation = new Presentation();

        // Reset the slide collection.
        presentation.Slides.Clear();

        // Add a blank slide.
        Slide slide = new Slide(SlideLayoutType.Blank);
        presentation.Slides.Add(slide);

        // Insert a chart on the slide.
        ChartEx chart = new ChartEx();
        slide.Shapes.Add(chart);

        // Set chart size to match the slide.
        chart.Width = presentation.SlideSize.Width;
        chart.Height = presentation.SlideSize.Height;

        // Create a treemap series.
        TreemapSeries series = new TreemapSeries();

        // Specify category hierarchy and values.
        series.Arguments = new ChartHierarchicalStringData(
            new string[] { "A", "A", "A", "A", "B", "B", "B", "B", "C", "C", "C", "C" },
            new string[] { "A1", "A2", "A3", "A4", "B1", "B2", "B3", "B4", "C1", "C2", "C3", "C4" });

        // Assign values for each category.
        series.Values = new ChartNumericData(
            new[] { 10.0, 12.0, 5.0, 8.0, 15.0, 10.0, 12.0, 5.0, 8.0, 15.0, 9.0, 11.0 });

        // Set the fill style for treemap tiles.
        series.Properties = new ChartElement { Fill = new SolidFill(Color.AliceBlue) };

        // Configure group labels and data labels.
        series.GroupLabelLayout = TreemapGroupLabelLayout.Banner;
        series.DataLabels.ShowCategoryName = true;
        series.DataLabels.ShowValue = true;

        // Add the series to the chart.
        chart.Series.Add(series);

        // Set chart title formatting.
        chart.Title = new ChartTitleEx(new TextArea {
            Text = "Treemap chart",
            Level1ParagraphProperties = new TextParagraphProperties {
                TextProperties = new TextProperties { FontSize = 30, Fill = new SolidFill(Color.DarkBlue) }
            }
        });

        // Save the result to a file.
        var outputPath = @"D:\presentation.pptx";
        using FileStream outputStream = new(outputPath, FileMode.Create, FileAccess.Write, FileShare.None);
        presentation.SaveDocument(outputStream);
    }
}
Implements
Inheritance
Object
OfficeObject
SeriesExBase
DataSeriesExBase
TreemapSeries
See Also