BoxAndWhiskerSeries.DataLabels Property
Gets or sets data label settings for this series.
Namespace: DevExpress.Docs.Office
Assembly: DevExpress.Docs.Core.v26.1.dll
NuGet Package: DevExpress.Docs.Core
Declaration
Property Value
| Type | Description |
|---|---|
| BoxAndWhiskerDataLabels | A BoxAndWhiskerDataLabels object that specifies point data label settings. |
Remarks
For additional information about data labels, refer to the following help topic: Data Labels.
Example
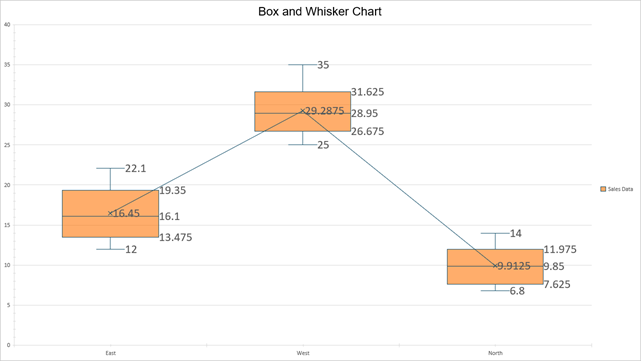
The following code snippet adds a Box and Whisker series to a presentation chart:
using DevExpress.Docs.Office;
using DevExpress.Docs.Presentation;
using System.Drawing;

namespace PresentationApiSample;
public class Program {
    public static async Task Main(string[] _) {

        // Create a presentation and add a blank slide.
        Presentation presentation = new Presentation();
        presentation.Slides.Clear();
        Slide slide = new Slide(SlideLayoutType.Blank);
        presentation.Slides.Add(slide);

        // Insert a chart that fills the slide.
        ChartEx chart = new ChartEx();
        chart.Width = presentation.SlideSize.Width;
        chart.Height = presentation.SlideSize.Height;
        slide.Shapes.Add(chart);

        // Configure the chart title.
        chart.Title = new ChartTitleEx(new TextArea("Box and Whisker Chart"));

        // Create the Box and Whisker series.
        var series = new BoxAndWhiskerSeries();
        series.Text = "Sales Data";

        // Each argument name repeats — the engine groups by name to form one box per category.
        series.Arguments = new ChartStringData([
            // Group "East" (8 observations)
            "East", "East", "East", "East", "East", "East", "East", "East",
            // Group "West" (8 observations)
            "West", "West", "West", "West", "West", "West", "West", "West",
            // Group "North" (8 observations)
            "North", "North", "North", "North", "North", "North", "North", "North"
        ]);

        // One numeric value per row — values at matching indices belong to that group.
        series.Values = new ChartNumericData([
                // East observations
                12.0, 15.5, 18.0, 14.3, 22.1, 19.8, 16.7, 13.2,
                // West observations
                25.0, 30.2, 28.5, 35.0, 27.8, 32.1, 29.4, 26.3,
                // North observations
                8.0, 10.5, 9.2, 11.0, 7.5, 12.3, 14.0, 6.8
        ]);

        // Configure Box and Whisker display options.
        series.ShowMeanLine = true;
        series.ShowMeanMarkers = true;
        series.ShowOutlierPoints = true;
        series.ShowInnerPoints = false;
        series.QuartileCalculationMode = QuartileCalculationMode.Exclusive;

        // Customize the series appearance.
        series.Properties = new ChartElement { Fill = new SolidFill(Color.FromArgb(150, 255, 114, 0)) };

        // Configure data labels for the series.
        series.DataLabels.ShowValue = true;
        series.DataLabels.TextProperties = new TextProperties { FontSize = 18 };

        // Add the series to the chart.
        chart.Series.Add(series);

        // Save the presentation to a file or export it.
        // ...
    }
}
See Also