BarChartViewBase.BarGrouping Property
Gets or sets how bars from multiple series are grouped.
Namespace: DevExpress.Docs.Office
Assembly: DevExpress.Docs.Core.v26.1.dll
NuGet Package: DevExpress.Docs.Core
Declaration
Property Value
| Type | Description |
|---|---|
| BarChartGrouping | A value that specifies bar grouping behavior. |
Available values:
| Name | Description |
|---|---|
| Standard | 3D column chart displays a third axis (depth axis) to show series names. The position of each bar along the value axis reflects its actual value. |
| Stacked | Series bars are stacked on top of each other. Each bar segment shows its absolute value contribution. |
| PercentStacked | Series bars are stacked and scaled so that the total bar height always occupies 100% of the chart height. |
| Clustered | Series bars are placed side by side for each category. Each series occupies its own bar with no overlap. |
Example
The following code snippet creates a stacked bar chart with two series:
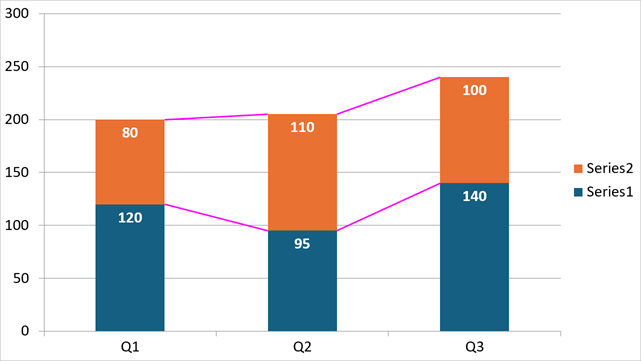
using DevExpress.Docs.Office;
using DevExpress.Docs.Presentation;
using System.Drawing;

namespace PresentationApiSample;
public class Program {
    public static async Task Main(string[] _) {

        // Create a presentation and add a blank slide.
        Presentation presentation = new Presentation();
        presentation.Slides.Clear();
        Slide slide = new Slide(SlideLayoutType.Blank);
        presentation.Slides.Add(slide);

        // Insert a chart that fills the slide.
        Chart chart = new Chart();
        chart.Width = presentation.SlideSize.Width;
        chart.Height = presentation.SlideSize.Height;
        slide.Shapes.Add(chart);

        chart.TextProperties = new TextProperties { FontSize = 24 };

        // Add the first bar series.
        BarSeries series1 = new BarSeries();
        series1.Arguments = new ChartStringData(new[] { "Q1", "Q2", "Q3" });
        series1.Values = new ChartNumericData(new double[] { 120, 95, 140 });
        chart.Series.Add(series1);

        // Add the second bar series.
        BarSeries series2 = new BarSeries();
        series2.Arguments = new ChartStringData(new[] { "Q1", "Q2", "Q3" });
        series2.Values = new ChartNumericData(new double[] { 80, 110, 100 });
        chart.Series.Add(series2);

        // Access the bar chart view and customize its appearance.
        BarChartView view = (BarChartView)chart.Views[0];

        view.BarGrouping = BarChartGrouping.Stacked;
        view.GapWidth = 150;
        view.Overlap = 100;

        // Configure line formatting for chart series.
        view.SeriesLineProperties = new ChartElement { OutlineStyle = new OutlineStyle { Fill = new SolidFill(Color.Magenta), Width = 10 } };
        view.DataLabels.ShowValue = true;
        view.DataLabels.LabelPosition = BarDataLabelPosition.InsideEnd;
        view.DataLabels.TextProperties = new TextProperties { Fill = new SolidFill(Color.White), Bold = true, FontSize = 24 };
    }
}