Area3DChartView.GapDepth Property
Gets or sets the distance between series in the depth direction.
Namespace: DevExpress.Docs.Office
Assembly: DevExpress.Docs.Core.v26.1.dll
Declaration
Property Value
| Type | Description |
|---|---|
| Int32 | An integer value that specifies the depth gap between series. |
Example
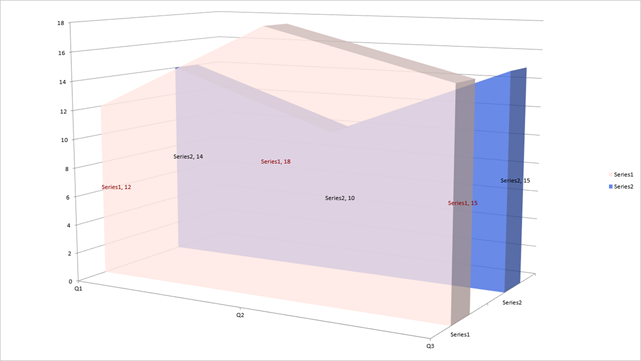
The following code snippet creates two 3D area series to a presentation chart and customizes the corresponding view:
using DevExpress.Docs.Office;
using DevExpress.Docs.Presentation;
using System.Drawing;

namespace PresentationApiSample;

public class Program {
    public static async Task Main(string[] _) {

        // Create a presentation and add a blank slide.
        Presentation presentation = new Presentation();
        presentation.Slides.Clear();
        Slide slide = new Slide(SlideLayoutType.Blank);
        presentation.Slides.Add(slide);

        // Insert a chart that fills the slide.
        Chart chart = new Chart();
        chart.Width = presentation.SlideSize.Width;
        chart.Height = presentation.SlideSize.Height;
        slide.Shapes.Add(chart);

        // Add the first 3D area series.
        Area3DSeries series1 = new Area3DSeries();
        series1.Arguments = new ChartStringData(new[] { "Q1", "Q2", "Q3" });
        series1.Values = new ChartNumericData(new double[] { 12, 18, 15 });
        chart.Series.Add(series1);

        // Set fill and labels for the first series.
        series1.Properties = new ChartElement { Fill = new SolidFill(Color.FromArgb(200, Color.MistyRose)) };
        series1.DataLabels.ShowValue = true;
        series1.DataLabels.ShowSeriesText = true;
        series1.DataLabels.TextProperties = new TextProperties { Fill = new SolidFill(Color.DarkRed) };

        // Add the second 3D area series.
        Area3DSeries series2 = new Area3DSeries();
        series2.Arguments = new ChartStringData(new[] { "Q1", "Q2", "Q3" });
        series2.Values = new ChartNumericData(new double[] { 14, 10, 15 });
        chart.Series.Add(series2);

        // Set fill and labels for the second series.
        series2.Properties = new ChartElement { Fill = new SolidFill(Color.FromArgb(200, Color.RoyalBlue)) };

        series2.DataLabels.ShowValue = true;
        series2.DataLabels.ShowSeriesText = true;
        series2.DataLabels.TextProperties = new TextProperties { Fill = new SolidFill(Color.Black) };

        // Access the corresponding view and customize depth settings.
        Area3DChartView view = (Area3DChartView)chart.Views[0];
        view.GapDepth = 200;

        // Set the chart rotation options.
        chart.View3D = new View3DOptions { XRotation = 10, YRotation = 30 };

        // Save the presentation to a file or export it.
        // ...
    }
}
See Also