How to Group Rows in DevExpress Data Grid for .NET MAUI
- 12 minutes to read
DataGridView allows you to group data by a single column.

Groups of data rows (rows that have identical values in a specified column) are separated with group rows that a user can tap to expand or collapse groups. You can also display summary information about groups (for example, the sum of values, the number of records, the minimum or maximum value) within group rows.
The DataGridView uses unique integer indexes called row handles to identify group rows and their nested rows:

Group headers (also called group rows) display the value (or value range), which is the same for all rows in this group. You can format the group value and display group summaries (the sum of values, number of rows, minimum/maximum value, and so on). Users can collapse and expand groups.
Group Rows in Markup
Enable a column’s IsGrouped option to group grid rows by values in this column. Note that the DataGridView component cannot group rows by multiple data fields.
The following example shows how to group orders by purchase date:

<dxg:DataGridView ItemsSource="{Binding Orders}">
    <dxg:DataGridView.Columns>
         <!-- ... -->
        <dxg:DateColumn FieldName="Date" DisplayFormat="d"
                        IsGrouped="true" GroupInterval="Date"/>
         <!-- ... -->
    </dxg:DataGridView.Columns>
</dxg:DataGridView>
Group Rows by Value Ranges
Initially, the DataGridView groups strings and dates by the exact value, but you can group rows by value ranges. Set a column’s GroupInterval property to one of the following modes to specify the value range:
- Alphabetical
- Data rows are grouped alphabetically instead of by exact values in the group column.
- DateMonth
- Data rows are grouped by months.
- DateYear
- Data rows are grouped by years.
- DateRange
- Data rows are grouped by predefined ranges (“Next Month”, “Earlier this Month”, and so on) instead of exact dates.
- DisplayText
- Data rows are grouped by the text displayed in cells instead of data field values.
The code below groups data rows by predefined value ranges:

<dxg:DataGridView ItemsSource="{Binding Orders}">
    <dxg:DataGridView.Columns>
         <!-- ... -->
        <dxg:DateColumn x:Name="dateColumn1"
                        FieldName="Date"
                        DisplayFormat="d"
                        IsGrouped="true"
                        GroupInterval="DateRange"/>
         <!-- ... -->
    </dxg:DataGridView.Columns>
</dxg:DataGridView>
Manage Group Column Visibility
The DataGridView hides the column whose values are used to group rows. Use the ShowGroupedColumns property to specify whether this column is displayed.
The following example displays the Date column used to group grid rows:

<dxg:DataGridView x:Name="grid"
                  ItemsSource="{Binding Orders}"
                  ShowGroupedColumns="True">
    <dxg:DataGridView.Columns>
        <!--...-->
        <dxg:DateColumn FieldName="Date" DisplayFormat="d"
                        IsGrouped="True"
                        GroupInterval="Date"/>
        <!--...-->
    </dxg:DataGridView.Columns>
</dxg:DataGridView>
Group Rows in Code
Call the DataGridView.GroupBy method to group data rows in code. The method accepts a data field name or GridColumn object. The code below shows how to group by the Date data field.
<Button Grid.Row="0" Clicked="Button_Clicked" Text="Group Rows"/>
<dxg:DataGridView x:Name="grid" ItemsSource="{Binding Orders} Grid.Row="1">
    <dxg:DataGridView.Columns>
        <dxg:DateColumn FieldName="Date" DisplayFormat="d" x:Name="DateColumn" GroupInterval="Date"/>
        <!--...-->
    </dxg:DataGridView.Columns>
</dxg:DataGridView>
private void Button_Clicked(object sender, EventArgs e) {
    // If you declare columns in markup,
    // you can pass a column object to this method.
    grid.GroupBy(DateColumn);

    // This code line groups orders by date.
    // You can use this overload if columns are generated automatically.
    grid.GroupBy("Date");
}
Call the ClearGrouping method to ungroup rows in the grid. Use the DataGridView.IsGrouped property to check whether grid data rows are grouped.
Use the GroupCount property to get the number of resulting groups (the number of resulting group rows).
To check whether a row is a group row, call the IsGroupRow method.
Use the following API to obtain information about nested rows of a group:
- GetParentRowHandle
- Returns the group row handle that identifies the group to which the specified data row belongs.
- GetChildRowCount
- Returns the number of data rows in a specific group.
- GetChildRowHandle
- Returns the handle of a row at the specified position within the specified group.
Collapse and Expand Groups
Users can collapse and expand grouped rows. The initial state depends on the AutoExpandAllGroups option. To prevent users from collapsing row groups, set the DataGridView.AllowGroupCollapse property to false.
Collapse and Expand Groups in Code
Use the following methods to collapse and expand row groups in code:
- CollapseAllGroups
- Collapses all groups of rows.
- ExpandAllGroups
- Expands all groups of rows.
- CollapseGroupRow
- Collapses the specified group of rows.
- ExpandGroupRow
- Expands the specified group of rows.
The IsGroupCollapsed method allows you to determine whether a specific group is collapsed.
Respond to User Actions when Collapsing and Expanding Groups
The DataGridView ships with the following events that fire before/after a group is collapsed/expanded. You can handle these events to cancel a collapse/expand operation, display a notification, and so on:
- GroupCollapsing
- Occurs before a group of rows is collapsed.
- GroupCollapsed
- Occurs after a group of rows has been collapsed.
- GroupExpanding
- Occurs before a group of rows is expanded.
- GroupExpanded
- Occurs after a group of rows has been expanded.
The example below shows how to prevent the “Today” group in the grid from being collapsed. To obtain the group value, the DataGridView.GetGroupValue method is used.
<dxg:DataGridView x:Name="grid" ItemsSource="{Binding Orders}"
                  GroupCollapsing="grid_GroupCollapsing">
    <dxg:DataGridView.Columns>
        <!--...-->
        <dxg:DateColumn x:Name="DateColumn"
                        FieldName="Date"
                        DisplayFormat="d"
                        GroupInterval="DateRange"
                        IsGrouped="True"/>
        <!--...-->
    </dxg:DataGridView.Columns>
</dxg:DataGridView>
private void grid_GroupCollapsing(object sender, RowAllowEventArgs e) {
    string groupValue = (string)grid.GetGroupValue(e.RowHandle);
    if (groupValue == "Today") e.Allow = false;
}
Drag Grouped Rows
You can drag a row between groups. If you drop a row onto a different group, the control updates the row’s data accordingly.
To allow drag and drop operations, enable the DataGridView.AllowDragDropRows property. Enable the DataGridView.AllowDragDropSortedRows option so users can drag rows to a new position.
For more information, refer to the following section: Drag and Drop Rows.
Obtain Group Value
The value used to arrange multiple data rows into a single group is displayed in the group header (group row). The displayed value can be the actual data value or a value formatted according to the DisplayFormat expression (refer to SortMode for more information).
You can use the following methods to obtain a value displayed in a specific group’s header:
- GetGroupValue
- Returns the actual data value.
- GetGroupDisplayText
- Returns the actual or formatted value depending on the SortMode option.

Show Group Summaries
To display a group summary, add a GridColumnSummary object to the grid’s GroupSummaries collection and specify its Type and FieldName properties.
You can display one or more summaries in a group header. The following aggregate functions are available:
- Average
- The average value of a group of rows or an entire column.
- Count
- The number of records in a group or an entire column.
- Min
- The minimum value in a group of rows or an entire column.
- Max
- The maximum value in a group of rows or an entire column.
- Sum
- The sum of values in a group of rows or an entire column.
The code below shows how to display the sum of values in a specific column for each group:

<dxg:DataGridView x:Name="grid" ItemsSource="{Binding Orders}">
    <dxg:DataGridView.GroupSummaries>
        <dxg:GridColumnSummary FieldName="Product.Name" Type="Count"/>
        <dxg:GridColumnSummary FieldName="Product.UnitPrice" Type="Average"/>
        <dxg:GridColumnSummary FieldName="Total" Type="Sum"/>
    </dxg:DataGridView.GroupSummaries>
    <dxg:DataGridView.Columns>
        <dxg:DateColumn FieldName="Date" DisplayFormat="d" x:Name="DateColumn"
                        GroupInterval="DateRange" IsGrouped="True"/>
        <dxg:TextColumn FieldName="Product.Name" Caption="Product" />
        <dxg:NumberColumn FieldName="Product.UnitPrice" Caption="Price" DisplayFormat="C0"/>
        <dxg:NumberColumn FieldName="Quantity" />
        <dxg:NumberColumn FieldName="Total"
                          UnboundType="Integer" UnboundExpression="[Quantity] * [Product.UnitPrice]"
                          IsReadOnly="True" DisplayFormat="C0" />
        <dxg:CheckBoxColumn FieldName="Shipped" />
    </dxg:DataGridView.Columns>
</dxg:DataGridView>
To obtain the resulting summary for a specific column and group, call the DataGridView.GetGroupSummaryValue method.
The DataGridView also allows you to calculate TotalSummaries for columns.
For more information about summaries, refer to the following help topic: Data Summaries.
Format Group Summaries
The default summary displays the field name and the aggregate function followed by the calculated value. The value is formatted according to the GridColumn.DisplayFormat setting. The table below contains the default formats per aggregate function:
| Summary Type | Total Summary Format | Group Summary Format |
|---|---|---|
| Average | AVG={0:columnDisplayFormat} | summaryFieldName: AVG={0:columnDisplayFormat} |
| Count | {0} | {0} |
| Min | MIN={0:columnDisplayFormat} | summaryFieldName: MIN={0:columnDisplayFormat} |
| Max | MAX={0:columnDisplayFormat} | summaryFieldName: MAX={0:columnDisplayFormat} |
| Sum | SUM={0:columnDisplayFormat} | summaryFieldName: SUM={0:columnDisplayFormat} |
Use the GridColumnSummary.DisplayFormat property to apply a custom format to the summary display text.

<dxg:DataGridView.GroupSummaries>
    <dxg:GridColumnSummary FieldName="Product.UnitPrice"
                           Type="Average"
                           DisplayFormat="(Average) = {0:c2}"/>
</dxg:DataGridView.GroupSummaries>
In XAML, insert empty brackets into the beginning of a format string if it starts with a placeholder. Refer to the following page for more information: {} Escape sequence / markup extension. For example: “{}{0:c2}”.
Create Custom Summaries
Handle the DataGridView.CustomSummary event to compute summaries based on a custom rule.
The following example uses predefined aggregate functions (Max and Sum) and a custom rule to calculate group and total summaries for a grid that displays orders grouped by dates.
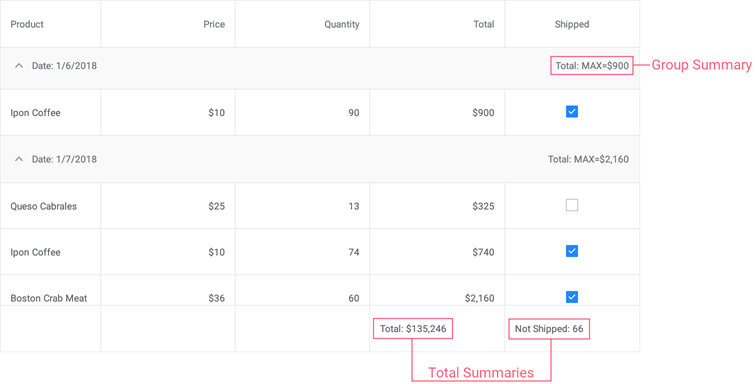
Set up the following summaries:
- A group summary to display the maximum Total value for each group of orders.
- A total summary to calculate the sum of values in the Total column.
- A custom total summary to count the number of orders with the false value in the Shipped column.
<dxg:DataGridView x:Name="grid" ItemsSource="{Binding Orders}"
                  CustomSummary="grid_CalculateCustomSummary">
    <!-- ... -->
    <dxg:DataGridView.GroupSummaries>
        <dxg:GridColumnSummary FieldName="Total" Type="Max"/>
    </dxg:DataGridView.GroupSummaries>

    <dxg:DataGridView.TotalSummaries>
        <dxg:GridColumnSummary FieldName="Total" Type="Sum"
                               DisplayFormat="Total: {0:C0}"/>
        <dxg:GridColumnSummary FieldName="Shipped" Type="Custom"
                               DisplayFormat="Not Shipped: {0}"/>
    </dxg:DataGridView.TotalSummaries>
</dxg:DataGridView>
int count;
// ...

private void grid_CustomSummary(object sender, DevExpress.Maui.DataGrid.CustomSummaryEventArgs e) {
    if (e.FieldName.ToString() == "Shipped")
        if (e.IsTotalSummary) {
            if (e.SummaryProcess == DevExpress.Maui.Core.DataSummaryProcess.Start) {
                count = 0;
            }
            if (e.SummaryProcess == DevExpress.Maui.Core.DataSummaryProcess.Calculate) {
                if (!(bool)e.Value)
                    count++;
                e.TotalValue = count;
            }
        }
}
Create a Custom Grouping Rule
If you group data, the control always sorts the data first. In many cases, sorting and grouping operations arrange rows in the same order. For example, you may want to group date-time values by decades. The control sorts the records in a regular ascending or descending order. It can then separate that sorted data into groups. You need to handle only the DataGridView.CustomGroup event to specify that if values belong to the same decade, then they belong to the same group.

You may also need to group data in such a way, that the order of records is different for grouped and sorted data. For example, you may want to sort numeric values in regular ascending or descending order, but group them based on whether values are odd or even. In that case, you need to handle the DataGridView.CustomGroup event to specify if two values belong in the same group (both odd or both even). You also need to handle the DataGridView.CustomSort event so you can arrange values before they are broken down into groups (first display odd values then even, or vice versa). In this case, make sure that custom sorting is only applied if the data is grouped.

You can also apply a custom sorting rule before you group data when you do not want to sort rows in a decade:

To apply a custom grouping rule to a grid column, set the column’s SortMode property to Custom and then handle the grid’s CustomGroup event.
The event fires each time the control needs to compare two rows.
The CustomGroupEventArgs.Column property returns the column that is being processed. The CustomGroupEventArgs.SourceIndex1 and CustomGroupEventArgs.SourceIndex2 properties return the indexes of the rows that are compared. The cell values used to compare rows are specified by the CustomGroupEventArgs.Value1 and CustomGroupEventArgs.Value2 properties.
When handling the GridView.CustomGroup event, use the following values to set the CustomGroupEventArgs.GroupsEqual property as the result of the custom comparison operation:
True- to indicate that the rows should be combined into the same group.False- to indicate that the rows should be placed within different groups.
The following example groups integers in the numeric grid column by parity:
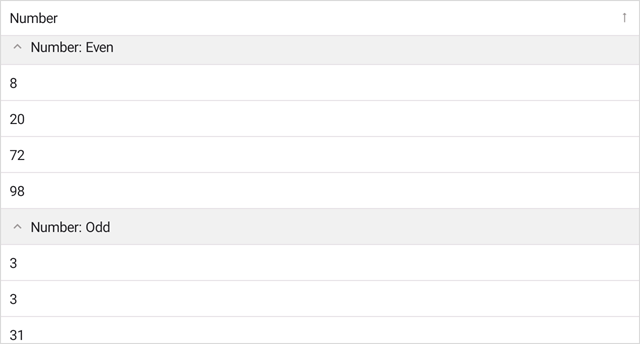
To group rows as in the grid above, follow the steps below:
Handle the DataGridView.CustomSort event to sort values in a custom manner. If users sort data in ascending order, the grid displays even numbers first, then odd numbers. Set the DataGridView.SortMode property to
Customto apply the custom sort algorithm.Enable the GridColumn.IsGrouped property for a column whose values you want to use to group rows. Handle the DataGridView.CustomGroup event to apply a custom grouping algorithm. This example divides column values into two groups of even and odd values. To show the group column, set the DataGridView.ShowGroupedColumns property to
true.Handle the DataGridView.CustomGroupDisplayText event to format group captions based on a condition. In this example, the display text is set based on the Value property value. The
Valueproperty contains the value of the first row in the group.
<ContentPage xmlns="http://schemas.microsoft.com/dotnet/2021/maui"
             xmlns:x="http://schemas.microsoft.com/winfx/2009/xaml"
             xmlns:dxg="clr-namespace:DevExpress.Maui.DataGrid;assembly=DevExpress.Maui.DataGrid"
             xmlns:ios="clr-namespace:Microsoft.Maui.Controls.PlatformConfiguration.iOSSpecific;assembly=Microsoft.Maui.Controls"
             xmlns:local="clr-namespace:CustomGroups"
             x:Class="CustomGroups.MainPage">
    <ContentPage.BindingContext>
        <local:GridViewModel/>
    </ContentPage.BindingContext>
    <dxg:DataGridView x:Name="grid" ItemsSource="{Binding Data}"
                      CustomSort="grid_CustomColumnSort"
                      CustomGroup="grid_CustomColumnGroup"
                      CustomGroupDisplayText="grid_CustomGroupDisplayText"
                      ShowGroupedColumns="True" SelectionMode="None">
        <dxg:DataGridView.Columns>
            <dxg:NumberColumn FieldName="Number" Caption="Number"
                              SortMode="Custom" SortOrder="Ascending"
                              IsGrouped="True" HorizontalContentAlignment="Start" />
        </dxg:DataGridView.Columns>
    </dxg:DataGridView>
</ContentPage>
using DevExpress.Maui.DataGrid;

namespace DXMauiApp1 {
    public partial class MainPage : ContentPage {
        public MainPage() {
            InitializeComponent();
        }

        private void grid_CustomColumnSort(object sender, CustomSortEventArgs e) {
            if (e.Column.FieldName != "Number") return;
            var v1 = (int)e.Value1;
            var v2 = (int)e.Value2;
            var even1 = v1 % 2 == 0;
            var even2 = v2 % 2 == 0;
            if (even1 ^ even2)
                e.Result = even1 ? -1 : 1;
            else e.Result = Comparer<int>.Default.Compare(v1, v2);
        }

        private void grid_CustomColumnGroup(object sender, CustomGroupEventArgs e) {
            if (e.Column.FieldName != "Number") return;
            var v1 = (int)e.Value1;
            var v2 = (int)e.Value2;
            var isEven1 = v1 % 2 == 0;
            var isEven2 = v2 % 2 == 0;
            e.GroupsEqual = !(isEven1 ^ isEven2);
        }

        private void grid_CustomGroupDisplayText(object sender, CustomGroupDisplayTextEventArgs e) {
            if (e.Column.FieldName != "Number") return;
            e.DisplayText = ((int)e.Value % 2 == 0 ? "Even" : "Odd");
        }
    }

    public class GridViewModel {
        int itemCount = 10;
        Random rnd = new Random();
        public ObservableCollection<DataEntry> Data { get; private set; }
        public GridViewModel() {
            Data = new ObservableCollection<DataEntry>();
            for (int i = 0; i < itemCount; i++) {
                Data.Add(new DataEntry(rnd.Next(0, 100)));
            }
        }
        public class DataEntry {
            public int Number { get; private set; }
            public DataEntry(int number) {
                Number = number;
            }
        }
    }
}
Enable Live Data Recalculation
Enable the DataGridView.AllowLiveDataShaping property to recalculate DataGridView values and refresh it when users filter, group, and sort data.