ItemClickEventArgs Interface
Supplies data for the ItemClick event.
Declaration
export interface ItemClickEventArgs extends DashboardItemBaseEventArgsRemarks
Use the onItemClick handler to raise the ItemClick event.
Example
How to Obtain a Dashboard Item’s Client Data in ASP.NET Core
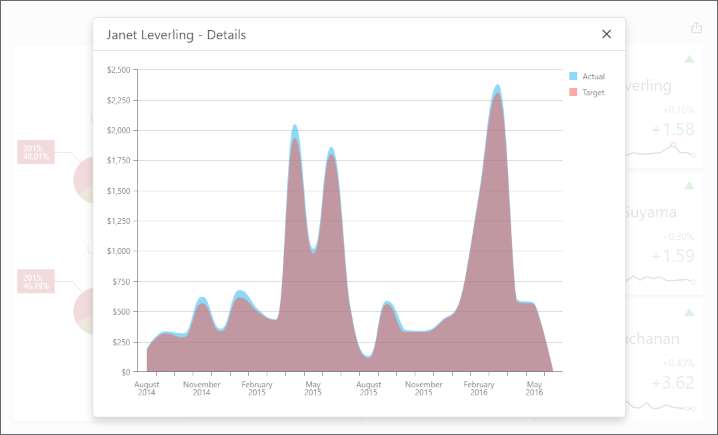
The following example uses the DashboardControl‘s client-side API to obtain client data that corresponds to a particular visual element. When you click a card, the dxChart displays the detailed chart and shows a variation of actual/target values over time.
Handle the DashboardControlOptions.onBeforeRender event to get access to the DashboardControl instance:
<div id="myPopup"></div>
<div style="position: absolute; left: 0; top: 0; right: 0; bottom: 0;">
@(Html.DevExpress().Dashboard("dashboardControl1")
    .ControllerName("DefaultDashboard")
    .Width("100%")
    .Height("100%")
    .OnBeforeRender("onBeforeRender")
)
</div>
The ViewerApiExtensionOptions.onItemClick event is handled to obtain client data and invoke the dxPopup component with the dxChart.
In the event handler, the e.getData method call obtains the dashboard item’s client data. The e.getAxisPoint method returns the axis point corresponding to the clicked card while the ItemData.getSlice method returns the slice of client data by this axis point.
The ItemDataAxis.getPoints method is used to obtain axis points that belong to the “Sparkline” data axis. Call the ItemData.getDeltaValue method to obtain corresponding actual/target values:
function onBeforeRender(sender) {
    var dashboardControl = sender;

    var viewerApiExtension = dashboardControl.findExtension('viewerApi');
    if (viewerApiExtension)
        viewerApiExtension.on('itemClick', onItemClick);

    $("#myPopup").dxPopup({
        width: 800, height: 600,
        title: "Details",
        showCloseButton: true
    });
}

function onItemClick(args) {
    if (args.itemName == "cardDashboardItem1") {
        var clientData = [],
            clientDataTable = [],
            clickedItemData,
            delta;
        var sparklineAxis = "Sparkline",
            defaultAxis = "Default";

        clientData = args.getData();
        clickedPoint = args.getAxisPoint(defaultAxis);
        clickedItemData = clientData.getSlice(clickedPoint);
        delta = args.getDeltas()[0];

        for (var i = 0; i < clickedItemData.getAxis(sparklineAxis).getPoints().length; i++) {
            var dataTableRow = {},
                axisPoint = clickedItemData.getSlice(clickedItemData.getAxis(sparklineAxis).getPoints()[i]);

            dataTableRow["Argument"] = clickedItemData.getAxis(sparklineAxis).getPoints()[i].getValue();
            if (axisPoint.getDeltaValue(delta.id).getActualValue().getValue() != null &&
                axisPoint.getDeltaValue(delta.id).getTargetValue().getValue() != null) {
                dataTableRow["Actual"] = axisPoint.getDeltaValue(delta.id).getActualValue().getValue();
                dataTableRow["Target"] = axisPoint.getDeltaValue(delta.id).getTargetValue().getValue();
            }
            else {
                dataTableRow["Actual"] = 0;
                dataTableRow["Target"] = 0;
            }
            clientDataTable.push(dataTableRow);
        }

        var $chart = $('<div/>');
        $chart.dxChart({
            height: 500,
            dataSource: clientDataTable,
            series: [{
                valueField: 'Actual', name: 'Actual'
            }, {
                valueField: 'Target', name: 'Target'
            }
            ],
            commonSeriesSettings: {
                type: 'splineArea',
                argumentField: 'Argument',
                ignoreEmptyPoints: true
            },
            argumentAxis: {
                showZero: false,
                type: 'discrete'
            },
            valueAxis: {
                showZero: false,
                type: 'continuous',
                label: { format: 'currency' }
            }
        });

        var popup = $("#myPopup").data("dxPopup");
        popup.option('title', clickedPoint.getValue() + " - Details");
        $popupContent = popup.content();
        $popupContent.empty();
        $popupContent.append($chart);
        popup.show();
    };
}
Inheritance
Properties
getAxisPoint Property
Returns the axis point corresponding to the clicked visual element.
Declaration
getAxisPoint: (axis?: DevExpress.Dashboard.Data.ItemDataAxisName) => DevExpress.Dashboard.Data.ItemDataAxisPointProperty Value
| Type |
|---|
| (axis?: ItemDataAxisName) => ItemDataAxisPoint |
Remarks
See the following examples that show how to use the getAxisPoint property:
getData Property
Gets the dashboard item’s client data.
Declaration
getData: () => DevExpress.Dashboard.Data.ItemDataProperty Value
| Type |
|---|
| () => ItemData |
Remarks
See the following examples that show how to use the getData property:
getDeltas Property
Gets deltas corresponding to the clicked visual element.
Declaration
getDeltas: () => Array<DevExpress.Dashboard.Data.ItemDataDelta>Property Value
| Type |
|---|
| () => ItemDataDelta[] |
getDimensions Property
Gets the dimensions used to create a hierarchy of axis points for the specified axis.
Declaration
getDimensions: () => Array<DevExpress.Dashboard.Data.ItemDataDimension>Property Value
| Type |
|---|
| () => ItemDataDimension[] |
getMeasures Property
Gets measures corresponding to the clicked visual element.
Declaration
getMeasures: () => Array<DevExpress.Dashboard.Data.ItemDataMeasure>Property Value
| Type |
|---|
| () => ItemDataMeasure[] |
requestUnderlyingData Property
Gets underlying data corresponding to the clicked visual element.
Declaration
requestUnderlyingData: (onCompleted: (data: DevExpress.Dashboard.Data.ItemUnderlyingData) => void, dataMembers: string[]) => voidProperty Value
| Type | Description |
|---|---|
| (onCompleted: (data: ItemUnderlyingData) => void, dataMembers: string[]) => void | A function that is executed when the server sends a response. |
Remarks
The data parameter returns the ItemUnderlyingData object that contains a list of records from the dashboard data source.
The dataMembers parameter is optional. Add an array of string values to specify data members used to obtain underlying data. If you do not specify this parameter, underlying data are requested for all available data members.
Note that the requestUnderlyingData property does not return data for calculated fields that contain the aggr function.