ItemDataAxis Interface
An axis that contains data points corresponding to the specified value hierarchy.
Declaration
export interface ItemDataAxisExample
How to Obtain a Dashboard Item’s Client Data in ASP.NET Core
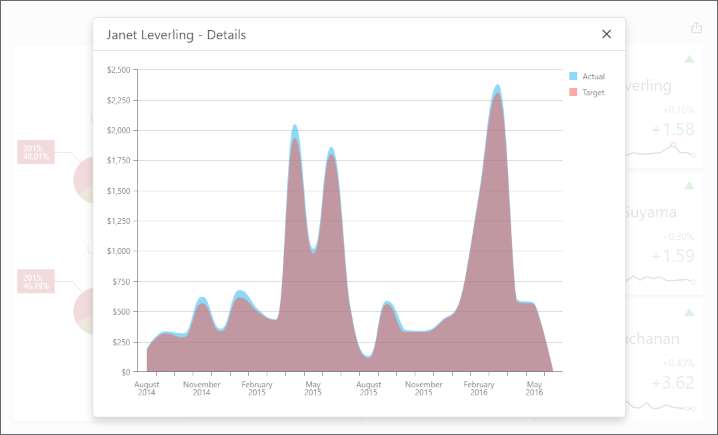
The following example uses the DashboardControl‘s client-side API to obtain client data that corresponds to a particular visual element. When you click a card, the dxChart displays the detailed chart and shows a variation of actual/target values over time.
Handle the DashboardControlOptions.onBeforeRender event to get access to the DashboardControl instance:
<div id="myPopup"></div>
<div style="position: absolute; left: 0; top: 0; right: 0; bottom: 0;">
@(Html.DevExpress().Dashboard("dashboardControl1")
    .ControllerName("DefaultDashboard")
    .Width("100%")
    .Height("100%")
    .OnBeforeRender("onBeforeRender")
)
</div>
The ViewerApiExtensionOptions.onItemClick event is handled to obtain client data and invoke the dxPopup component with the dxChart.
In the event handler, the e.getData method call obtains the dashboard item’s client data. The e.getAxisPoint method returns the axis point corresponding to the clicked card while the ItemData.getSlice method returns the slice of client data by this axis point.
The ItemDataAxis.getPoints method is used to obtain axis points that belong to the “Sparkline” data axis. Call the ItemData.getDeltaValue method to obtain corresponding actual/target values:
function onBeforeRender(sender) {
    var dashboardControl = sender;

    var viewerApiExtension = dashboardControl.findExtension('viewerApi');
    if (viewerApiExtension)
        viewerApiExtension.on('itemClick', onItemClick);

    $("#myPopup").dxPopup({
        width: 800, height: 600,
        title: "Details",
        showCloseButton: true
    });
}

function onItemClick(args) {
    if (args.itemName == "cardDashboardItem1") {
        var clientData = [],
            clientDataTable = [],
            clickedItemData,
            delta;
        var sparklineAxis = "Sparkline",
            defaultAxis = "Default";

        clientData = args.getData();
        clickedPoint = args.getAxisPoint(defaultAxis);
        clickedItemData = clientData.getSlice(clickedPoint);
        delta = args.getDeltas()[0];

        for (var i = 0; i < clickedItemData.getAxis(sparklineAxis).getPoints().length; i++) {
            var dataTableRow = {},
                axisPoint = clickedItemData.getSlice(clickedItemData.getAxis(sparklineAxis).getPoints()[i]);

            dataTableRow["Argument"] = clickedItemData.getAxis(sparklineAxis).getPoints()[i].getValue();
            if (axisPoint.getDeltaValue(delta.id).getActualValue().getValue() != null &&
                axisPoint.getDeltaValue(delta.id).getTargetValue().getValue() != null) {
                dataTableRow["Actual"] = axisPoint.getDeltaValue(delta.id).getActualValue().getValue();
                dataTableRow["Target"] = axisPoint.getDeltaValue(delta.id).getTargetValue().getValue();
            }
            else {
                dataTableRow["Actual"] = 0;
                dataTableRow["Target"] = 0;
            }
            clientDataTable.push(dataTableRow);
        }

        var $chart = $('<div/>');
        $chart.dxChart({
            height: 500,
            dataSource: clientDataTable,
            series: [{
                valueField: 'Actual', name: 'Actual'
            }, {
                valueField: 'Target', name: 'Target'
            }
            ],
            commonSeriesSettings: {
                type: 'splineArea',
                argumentField: 'Argument',
                ignoreEmptyPoints: true
            },
            argumentAxis: {
                showZero: false,
                type: 'discrete'
            },
            valueAxis: {
                showZero: false,
                type: 'continuous',
                label: { format: 'currency' }
            }
        });

        var popup = $("#myPopup").data("dxPopup");
        popup.option('title', clickedPoint.getValue() + " - Details");
        $popupContent = popup.content();
        $popupContent.empty();
        $popupContent.append($chart);
        popup.show();
    };
}
Methods
getDimensions Method
Declaration
getDimensions(): Array<ItemDataDimension>Returns
| Type |
|---|
| ItemDataDimension[] |
getPointByUniqueValues(values) Method
Declaration
getPointByUniqueValues(
    values: Array<DevExpress.Dashboard.Data.PrimitiveType>
): ItemDataAxisPoint
Parameters
| Name | Type |
|---|---|
| values | PrimitiveType[] |
Returns
| Type |
|---|
| ItemDataAxisPoint |
getPoints Method
Declaration
getPoints(): Array<ItemDataAxisPoint>Returns
| Type |
|---|
| ItemDataAxisPoint[] |
getPointsByDimension(dimensionId) Method
Declaration
getPointsByDimension(
    dimensionId: string
): Array<ItemDataAxisPoint>
Parameters
| Name | Type |
|---|---|
| dimensionId | string |
Returns
| Type |
|---|
| ItemDataAxisPoint[] |
getRootPoint Method
Declaration
getRootPoint(): ItemDataAxisPointReturns
| Type |
|---|
| ItemDataAxisPoint |