ItemData Interface
Multidimensional data visualized in the dashboard item.
Declaration
export interface ItemData
Each data-bound dashboard item uses a multidimensional representation of data (the ItemData class). Thus the control can visualize information hierarchically. For instance, the pivot grid allows users to expand or collapse column/row field values to view data at different detail levels. In dashboard items, users can also drill up and down through data to move between detail levels. Call the getItemData(itemName) method to obtain multidimensional data visualized in the specified dashboard item.
The value corresponding to a specific hierarchy level is stored in the ItemDataAxisPoint class that defines a data point in a multidimensional space. Such data points are placed on a specific data axis that is represented by the ItemDataAxis class. For instance, a pivot grid has the “Row” and “Column” axes, a chart has the “Argument” and “Series” axes, etc.
Use the following methods to access the displayed data:
- The getAxisNames property returns the names of available data axes. You can obtain the required axis using the getAxis(axisName) method.
- Use the getPoints method to obtain the axis points that are placed on the obtained data axis.
- Use the getDimensionValue method to obtain the dimension value.
Example
How to Obtain a Dashboard Item’s Client Data in ASP.NET Core
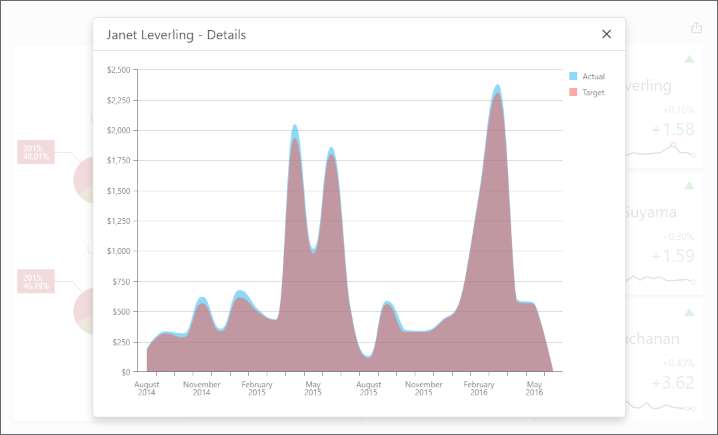
The following example uses the DashboardControl‘s client-side API to obtain client data that corresponds to a particular visual element. When you click a card, the dxChart displays the detailed chart and shows a variation of actual/target values over time.
View Example
Handle the DashboardControlOptions.onBeforeRender event to get access to the DashboardControl instance:
<div id="myPopup"></div>
<div style="position: absolute; left: 0; top: 0; right: 0; bottom: 0;">
@(Html.DevExpress().Dashboard("dashboardControl1")
    .ControllerName("DefaultDashboard")
    .Width("100%")
    .Height("100%")
    .OnBeforeRender("onBeforeRender")
)
</div>
The ViewerApiExtensionOptions.onItemClick event is handled to obtain client data and invoke the dxPopup component with the dxChart.
In the event handler, the e.getData method call obtains the dashboard item’s client data. The e.getAxisPoint method returns the axis point corresponding to the clicked card while the ItemData.getSlice method returns the slice of client data by this axis point.
The ItemDataAxis.getPoints method is used to obtain axis points that belong to the “Sparkline” data axis. Call the ItemData.getDeltaValue method to obtain corresponding actual/target values:
function onBeforeRender(sender) {
    var dashboardControl = sender;

    var viewerApiExtension = dashboardControl.findExtension('viewerApi');
    if (viewerApiExtension)
        viewerApiExtension.on('itemClick', onItemClick);

    $("#myPopup").dxPopup({
        width: 800, height: 600,
        title: "Details",
        showCloseButton: true
    });
}

function onItemClick(args) {
    if (args.itemName == "cardDashboardItem1") {
        var clientData = [],
            clientDataTable = [],
            clickedItemData,
            delta;
        var sparklineAxis = "Sparkline",
            defaultAxis = "Default";

        clientData = args.getData();
        clickedPoint = args.getAxisPoint(defaultAxis);
        clickedItemData = clientData.getSlice(clickedPoint);
        delta = args.getDeltas()[0];

        for (var i = 0; i < clickedItemData.getAxis(sparklineAxis).getPoints().length; i++) {
            var dataTableRow = {},
                axisPoint = clickedItemData.getSlice(clickedItemData.getAxis(sparklineAxis).getPoints()[i]);

            dataTableRow["Argument"] = clickedItemData.getAxis(sparklineAxis).getPoints()[i].getValue();
            if (axisPoint.getDeltaValue(delta.id).getActualValue().getValue() != null &&
                axisPoint.getDeltaValue(delta.id).getTargetValue().getValue() != null) {
                dataTableRow["Actual"] = axisPoint.getDeltaValue(delta.id).getActualValue().getValue();
                dataTableRow["Target"] = axisPoint.getDeltaValue(delta.id).getTargetValue().getValue();
            }
            else {
                dataTableRow["Actual"] = 0;
                dataTableRow["Target"] = 0;
            }
            clientDataTable.push(dataTableRow);
        }

        var $chart = $('<div/>');
        $chart.dxChart({
            height: 500,
            dataSource: clientDataTable,
            series: [{
                valueField: 'Actual', name: 'Actual'
            }, {
                valueField: 'Target', name: 'Target'
            }
            ],
            commonSeriesSettings: {
                type: 'splineArea',
                argumentField: 'Argument',
                ignoreEmptyPoints: true
            },
            argumentAxis: {
                showZero: false,
                type: 'discrete'
            },
            valueAxis: {
                showZero: false,
                type: 'continuous',
                label: { format: 'currency' }
            }
        });

        var popup = $("#myPopup").data("dxPopup");
        popup.option('title', clickedPoint.getValue() + " - Details");
        $popupContent = popup.content();
        $popupContent.empty();
        $popupContent.append($chart);
        popup.show();
    };
}
Methods
createTuple(values) Method
Declaration
createTuple(values: Array<ItemDataAxisPoint> | Array<{
    axisName: ItemDataAxisName;
    value: Array<DevExpress.Dashboard.Data.PrimitiveType>;
}>): ItemDataAxisPointTuple
Parameters
Returns
getAxis(axisName) Method
Declaration
getAxis(
    axisName: ItemDataAxisName
): ItemDataAxis
Parameters
Returns
getAxisNames Method
Declaration
getAxisNames(): Array<ItemDataAxisName>
Returns
getDataMembers Method
Declaration
getDataMembers(): Array<string>
Returns
getDeltas Method
Declaration
getDeltas(): Array<ItemDataDelta>
Returns
getDeltaValue(deltaId) Method
Declaration
getDeltaValue(
    deltaId: string
): ItemDataDeltaValue
Parameters
Returns
See the following examples that show how to use the getDeltaValue method:
View Example: ASP.NET Core View Example: ASP.NET Web Forms View Example: ASP.NET MVC
getDimensions(axisName) Method
Declaration
getDimensions(
    axisName: ItemDataAxisName
): Array<ItemDataDimension>
Parameters
Returns
getMeasures Method
Declaration
getMeasures(): Array<ItemDataMeasure>
Returns
getMeasureValue(measureId) Method
Declaration
getMeasureValue(
    measureId: string
): ItemDataMeasureValue
Parameters
| Name |
Type |
| measureId |
string |
Returns
getSlice(value) Method
Declaration
getSlice(
    value: ItemDataAxisPointTuple | ItemDataAxisPoint
): ItemData
Parameters
Returns