Get Started with Blazor Charts (Chart, Pie and Donut, Polar)
- 8 minutes to read
This tutorial describes how to build a simple Blazor application with DevExpress Blazor Charts.
Create an Application
Create an application as described in the following topic: Get Started With DevExpress Components for Blazor.
Enable Interactivity on a Page
Blazor Charts support static render mode to display data as static images. To use other features, enable interactivity on a Razor page, and allow chart components to execute scripts and display data.
Prepare a Data Source and Bind It to a Component
Create a
DataPointclass in one of the following folders:- Services for apps that target .NET 8 or .NET 9
- Data for other .NET versions
Add two fields to this class:
CountryandAppleProduction.public class DataPoint { public string Country { get; set; } public double AppleProduction { get; set; } public DataPoint(string country, double appleProduction) { Country = country; AppleProduction = appleProduction; } }In the same folder, create a
DataPointProviderclass to generate and return values:public class DataPointProvider { public static List<DataPoint> ReturnPoints() { return new List<DataPoint>() { new DataPoint("USA", 4.21), new DataPoint("China", 3.33), new DataPoint("Turkey", 2.6), new DataPoint("Italy", 2.2), new DataPoint("India", 2.16), }; } }Obtain generated data in the Index.razor file’s
@codeblock:@rendermode InteractiveServer @* For .NET 8 and .NET 9 apps *@ @using MyBlazorApp.Services @* For other .NET versions *@ @using MyBlazorApp.Data @code { IEnumerable<DataPoint> DataSource; protected override void OnInitialized() { DataSource = DataPointProvider.ReturnPoints(); } }Add chart component tags to the same
.razorfile:<DxChart> </DxChart> @code { // ... }Assign the
DataSourcecollection to the component’sDataproperty:<DxChart Data="DataSource"> </DxChart>
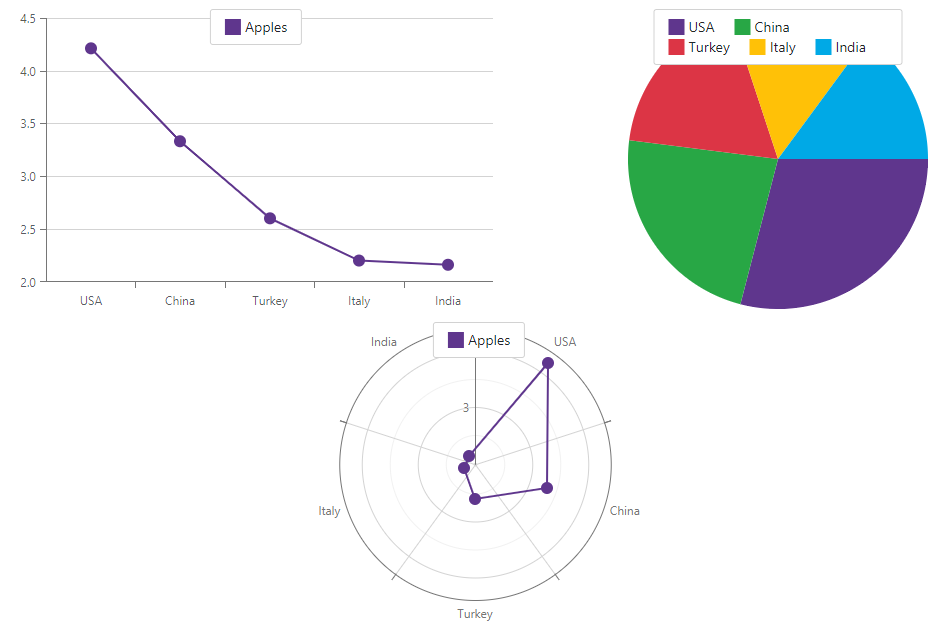
Add Series
Follow the steps below to create a series:
Add an appropriate series object to chart markup. Refer to the following topic for additional information on available series types: Series Types in Blazor Charts.
The following snippets create a line series in
<DxChart>and<DxPolarChart>, and a pie series in<DxPieChart>:<DxChart Data="DataSource"> <DxChartLineSeries /> </DxChart>Specify
ArgumentFieldandValueFieldproperties to populate the component with arguments and values, respectively. In the following code snippet, theCountryfield contains arguments and theAppleProductionfield contains values.<DxChart Data="DataSource"> <DxChartLineSeries ArgumentField="@((DataPoint v) => v.Country)" ValueField="@((DataPoint v) => v.AppleProduction)" /> </DxChart>Specify the
Nameproperty to assign a unique identifier to a series. This identifier allows you to manage series in code and serves as legend item text. Note that<DxPieChart>treats each sector as an individual point and generates legend items based on arguments. That is why theNameproperty does not affect the pie chart’s legend.<DxChart Data="DataSource"> <DxChartLineSeries ArgumentField="@((DataPoint v) => v.Country)" ValueField="@((DataPoint v) => v.AppleProduction)" Name="Apples" /> </DxChart>
If you add multiple series to <DxChart> or <DxPolarChart>, the component displays data on the same plane. Muiltiple series in one <DxPieChart> result in multiple nested rings in the same pie.
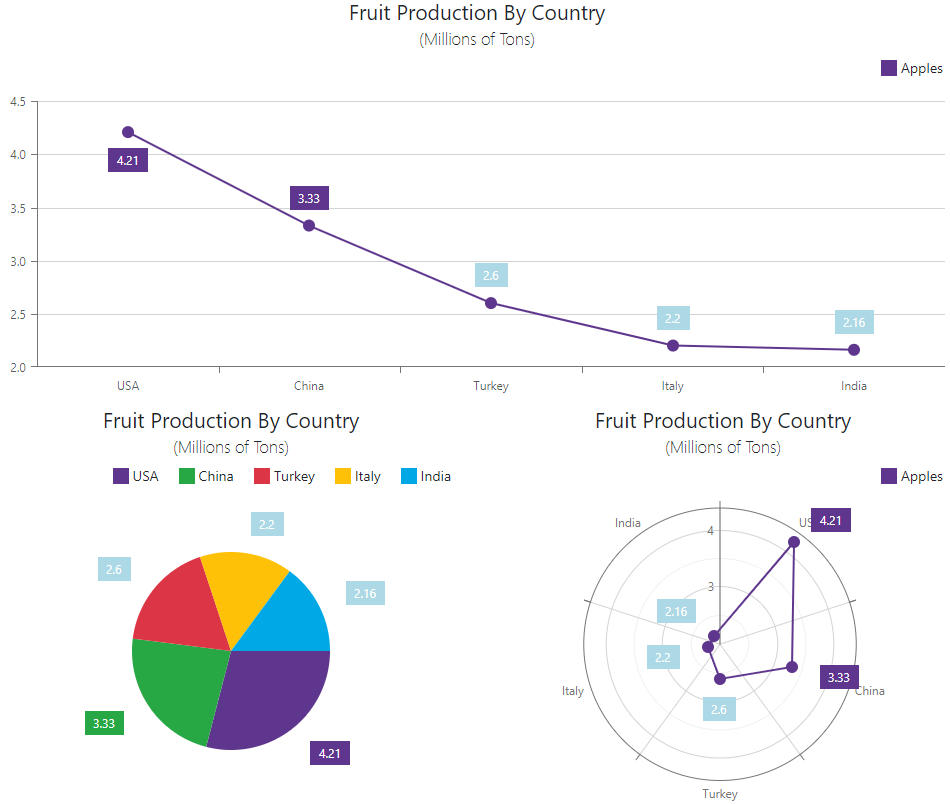
Show Series Labels
Add a DxChartSeriesLabel object to a series markup and set its Visible property to true:
@rendermode InteractiveServer
<DxChart Data="DataSource">
<DxChartLineSeries ArgumentField="@((DataPoint v) => v.Country)"
ValueField="@((DataPoint v) => v.AppleProduction)"
Name="Apples">
<DxChartSeriesLabel Visible="true" />
</DxChartLineSeries>
</DxChart>
If you have multiple series on one plane, you may want to set the component’s LabelOverlap property to ChartLabelOverlap.Hide to prevent labels from being displayed if they overlap.
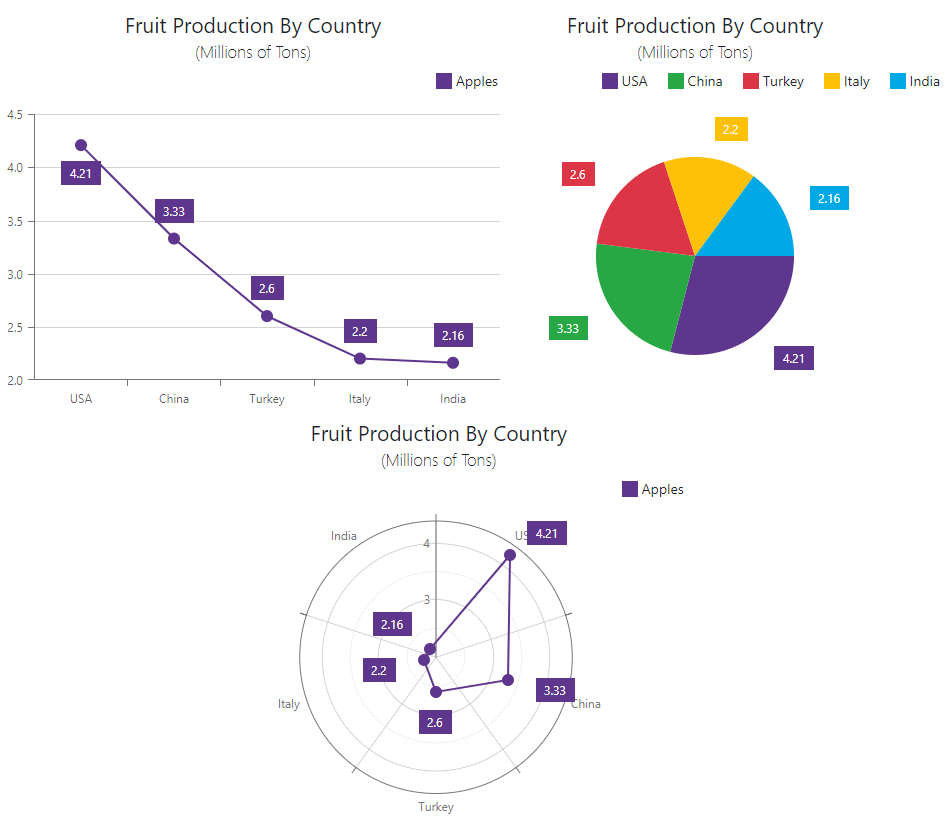
Add a Chart Title
Declare DxChartTitle and DxChartSubTitle objects and specify their Text properties.
@rendermode InteractiveServer
<DxChart Data="DataSource">
<DxChartLineSeries ArgumentField="@((DataPoint v) => v.Country)"
ValueField="@((DataPoint v) => v.AppleProduction)"
Name="Apples">
<DxChartSeriesLabel Visible="true" />
</DxChartLineSeries>
<DxChartTitle Text="Fruit Production By Country">
<DxChartSubTitle Text="(Millions of Tons)" />
</DxChartTitle>
</DxChart>
Apply Customizations
Blazor chart components support various customization options. Refer to the sections below for additional information.
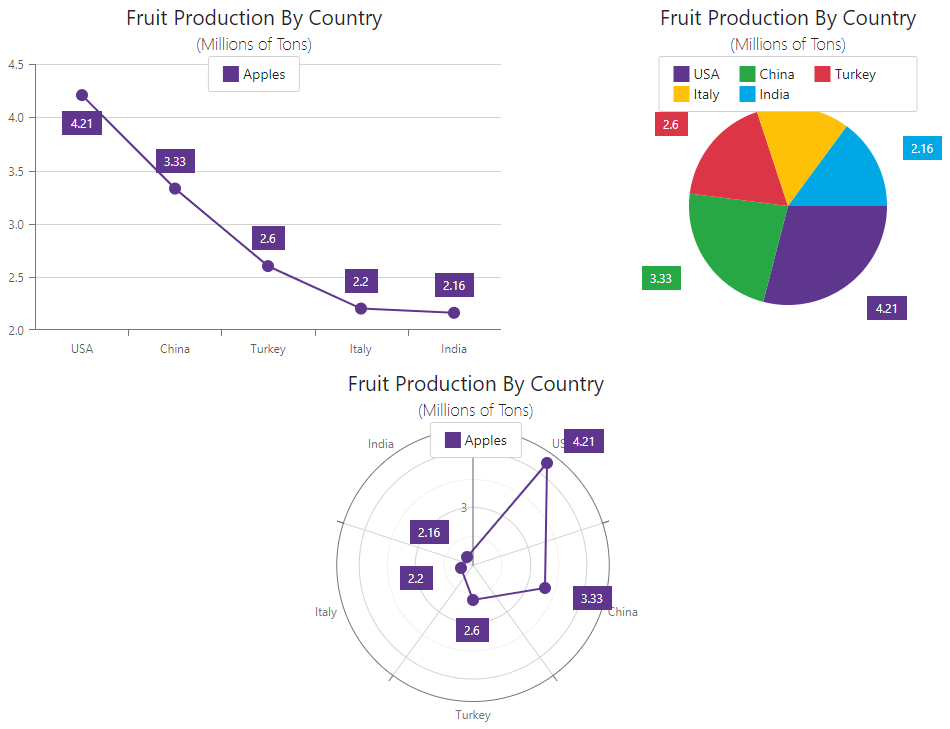
Position a Legend
Add a DxChartLegend object to chart markup and specify its properties as shown in the following code snippets:
@rendermode InteractiveServer
<DxChart Data="DataSource">
<DxChartLineSeries ArgumentField="@((DataPoint v) => v.Country)"
ValueField="@((DataPoint v) => v.AppleProduction)"
Name="Apples">
<DxChartSeriesLabel Visible="true" />
</DxChartLineSeries>
@* ... *@
<DxChartLegend Orientation="Orientation.Horizontal"
HorizontalAlignment="HorizontalAlignment.Right"
Position="RelativePosition.Outside" />
</DxChart>
This code snippet aligns the legend to the right and displays it above the chart plane.
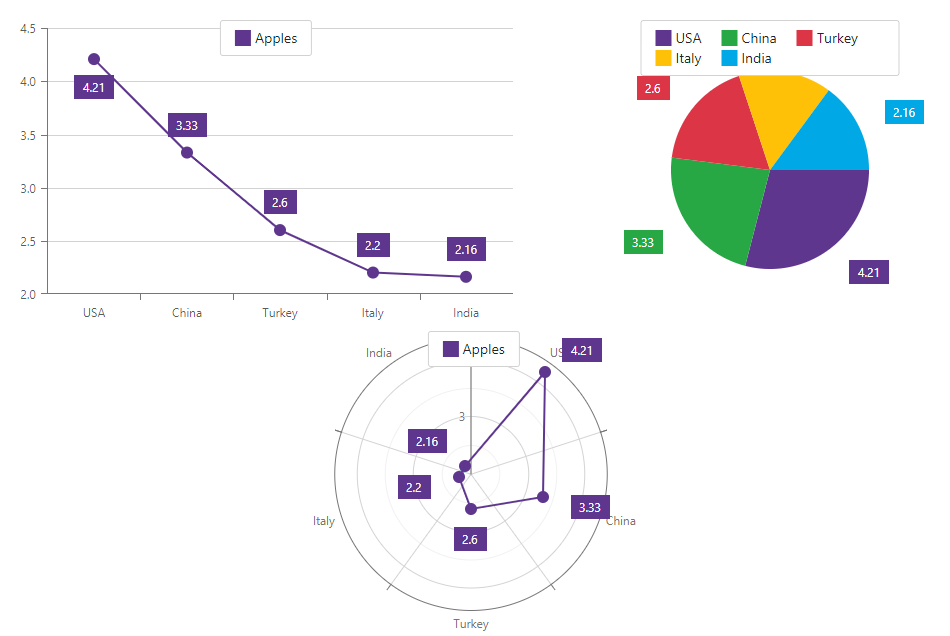
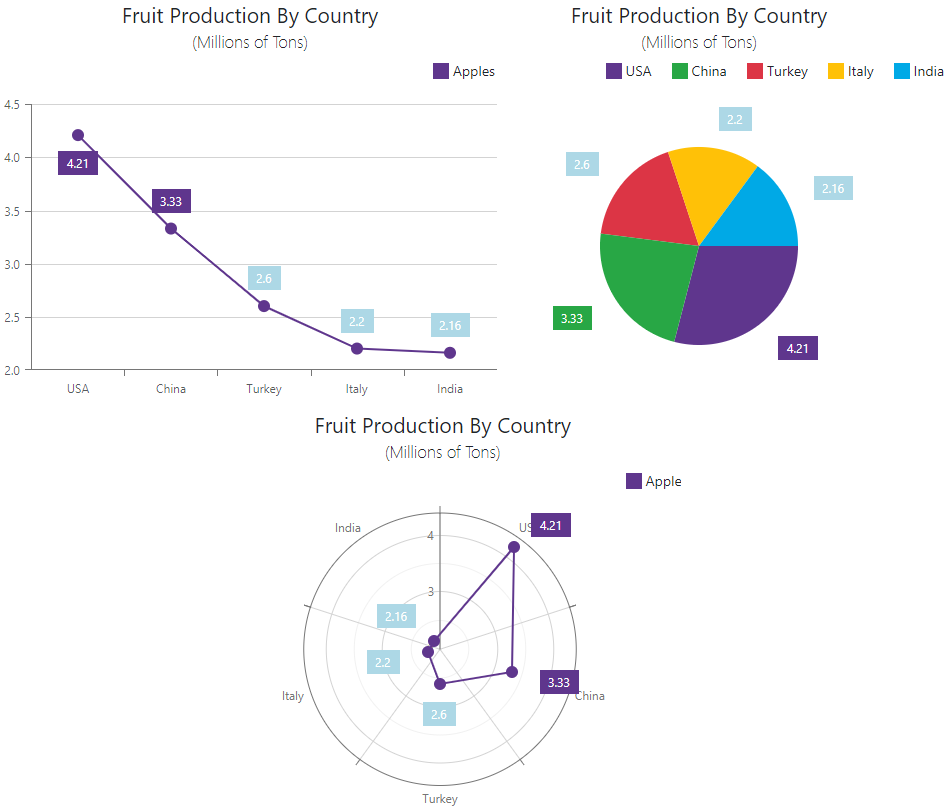
Change Appearance of Series Points and Their Labels
Handle the CustomizeSeriesPoint event to customize the appearance of series points, pie sectors, and their labels. The Point event argument allows you to access a series data point, analyze its values, and apply the required appearance to points and labels.
The following code snippet colors point labels blue if a data point’s value is less than 3:
@rendermode InteractiveServer
<DxChart Data="DataSource" CustomizeSeriesPoint="@OnCustomizeSeriesPoint">
<DxChartLineSeries ArgumentField="@((DataPoint v) => v.Country)"
ValueField="@((DataPoint v) => v.AppleProduction)"
Name="Apples">
<DxChartSeriesLabel Visible="true" />
</DxChartLineSeries>
@* ... *@
</DxChart>
@code {
@* ... *@
void OnCustomizeSeriesPoint(ChartSeriesPointCustomizationSettings args) {
if ((double)args.Point.Value < 3)
args.PointLabel.BackgroundColor = System.Drawing.Color.LightBlue;
}
}
Localization
The Chart component’s UI elements such as labels, context menus, and error messages are displayed in English. Localization automatically adapts the component to the user’s preferred language.
DevExpress components include predefined satellite resource assemblies for German, Spanish, and Japanese. Use the DevExpress Localization Service to create and download a custom set of satellite assemblies, and modify resources.
More Features
For additional information about chart features, refer to the following component class descriptions:
Complete Code
@rendermode InteractiveServer
@* For .NET 8 and .NET 9 apps *@
@using MyBlazorApp.Services
@* For other .NET versions *@
@using MyBlazorApp.Data
<DxChart Data="DataSource" CustomizeSeriesPoint="@OnCustomizeSeriesPoint">
<DxChartLineSeries ArgumentField="@((DataPoint v) => v.Country)"
ValueField="@((DataPoint v) => v.AppleProduction)"
Name="Apples">
<DxChartSeriesLabel Visible="true" />
</DxChartLineSeries>
<DxChartLegend Orientation="Orientation.Horizontal"
HorizontalAlignment="HorizontalAlignment.Right"
Position="RelativePosition.Outside" />
<DxChartTitle Text="Fruit Production By Country">
<DxChartSubTitle Text="(Millions of Tons)" />
</DxChartTitle>
</DxChart>
@code {
IEnumerable<DataPoint> DataSource;
protected override void OnInitialized() {
DataSource = DataPointProvider.ReturnPoints();
}
void OnCustomizeSeriesPoint(ChartSeriesPointCustomizationSettings args) {
if ((double)args.Point.Value < 3)
args.PointLabel.BackgroundColor = System.Drawing.Color.LightBlue;
}
}
public class DataPoint {
    public string Country { get; set; }
    public double AppleProduction { get; set; }
    public DataPoint(string country, double appleProduction) {
        Country = country;
        AppleProduction = appleProduction;
    }
}
public class DataPointProvider {
    public static List<DataPoint> ReturnPoints() {
        return new List<DataPoint>() {
               new DataPoint("USA", 4.21, 6.22),
               new DataPoint("China", 3.33, 8.65),
               new DataPoint("Turkey", 2.6, 4.25),
               new DataPoint("Italy", 2.2, 7.78),
               new DataPoint("India", 2.16, 2.26),
        };
    }
}