Blazor Chart
- 3 minutes to read
DevExpress Chart for Blazor (<DxChart>) helps you transform data into a concise and readable visual representation.
API Reference
Refer to the following list for the component API reference: DxChart Members.
Supported Series Types
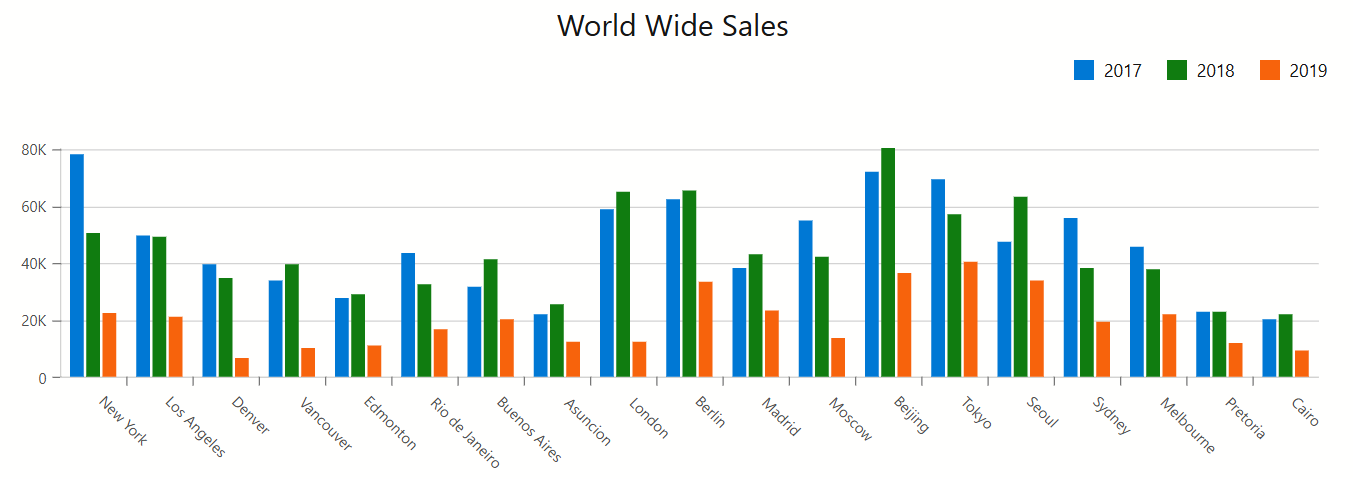
The DevExpress Blazor Chart component ships with different 2D chart types – from area and bars to financial OHLC views.
Data Binding
The DevExpress Blazor Chart supports various data binding scenarios:
For examples on how to bind to the most commonly used data collections, refer to the following sections:
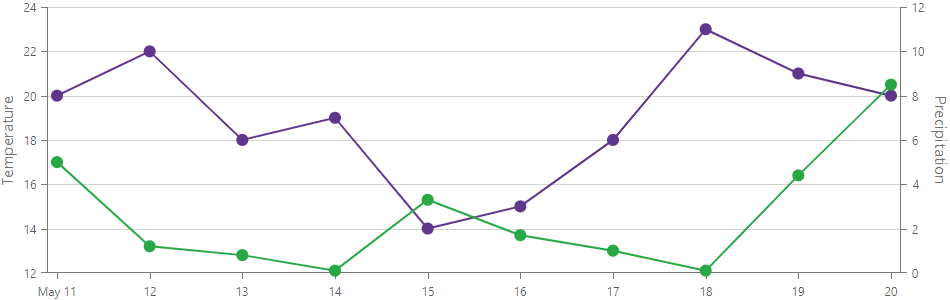
Axes
<DxChart> allows you to configure its axes and their visual elements (ticks, titles, constant lines, and so on).
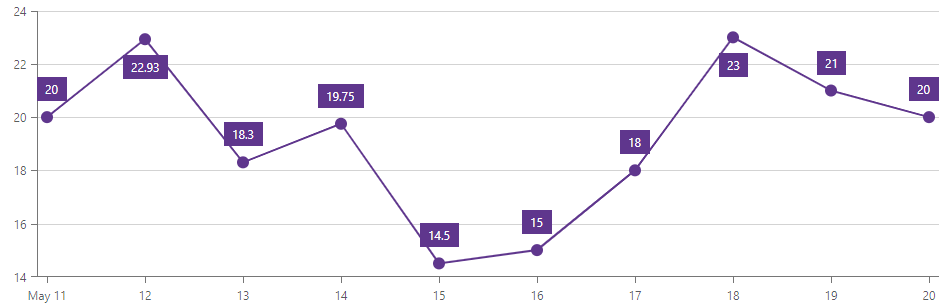
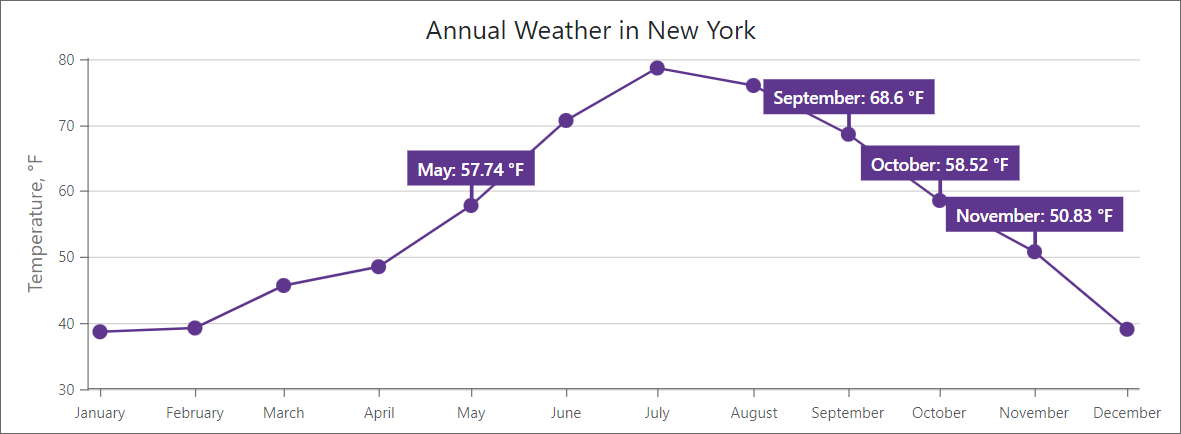
Labels
You can add labels to chart series and axes. You can format values and customize label appearance.
Zoom and Pan
<DxChart> supports the following zoom and pan operations:
- Zoom in / out (mouse wheel, zoom/pinch gestures)
- Zoom in to a specific area (select a rectangle with the mouse)
- Pan (mouse and scrollbar, swipe gestures)
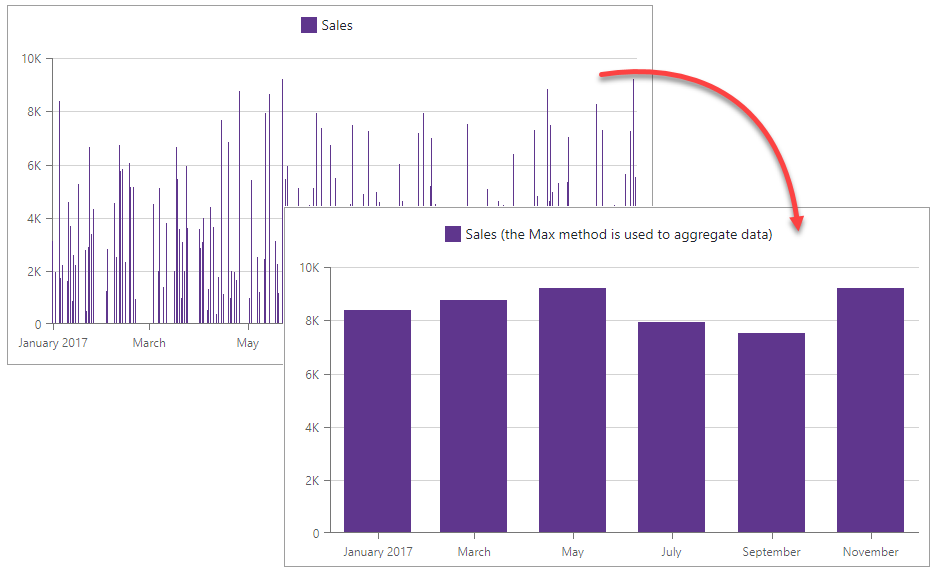
Data Aggregation
The <DxChart> component can use aggregate methods to group data and decrease the number of visible points. This feature allows you to optimize chart performance.
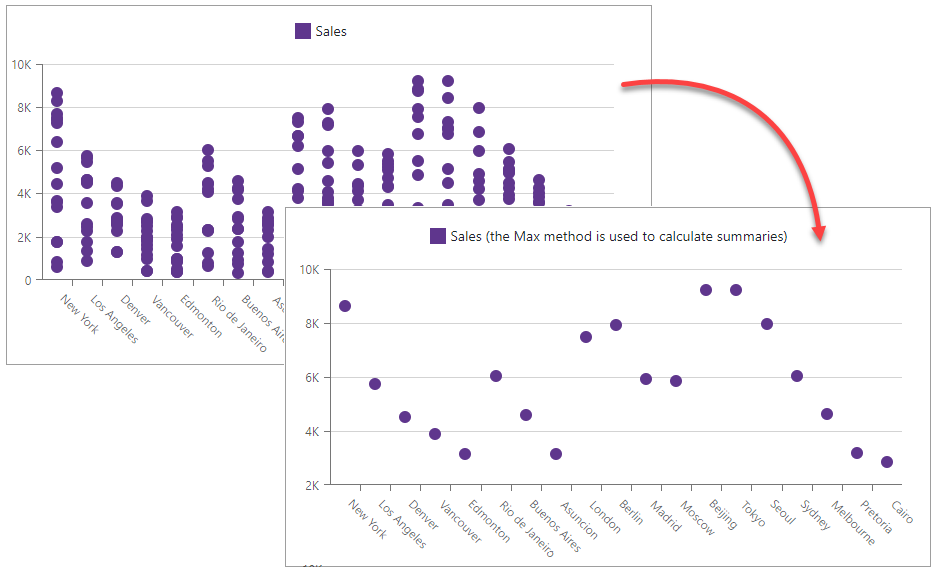
Data Summaries
The Chart component can calculate summaries for points with the same argument value and show the resulting values as series points.
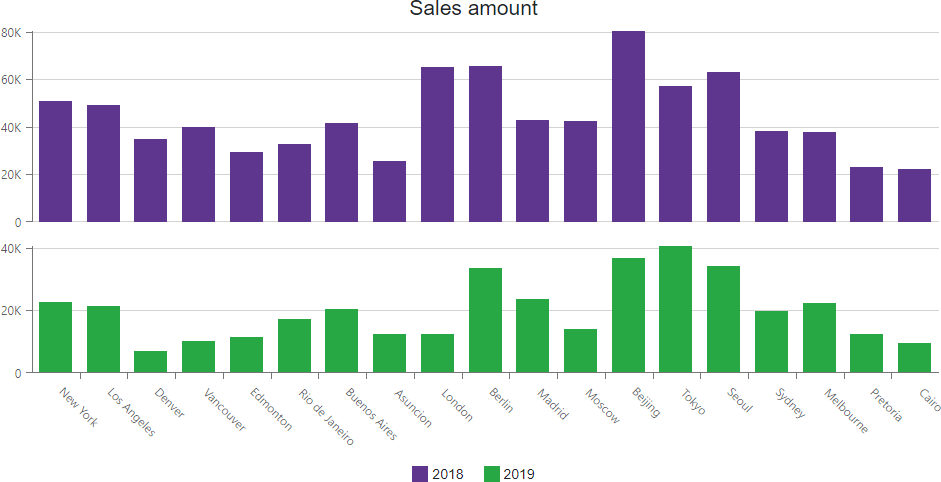
Multiple Panes
The Blazor Chart component allows you to create charts with multiple panes under each other. A pane can display one or more series and shares its argument axis with other panes.
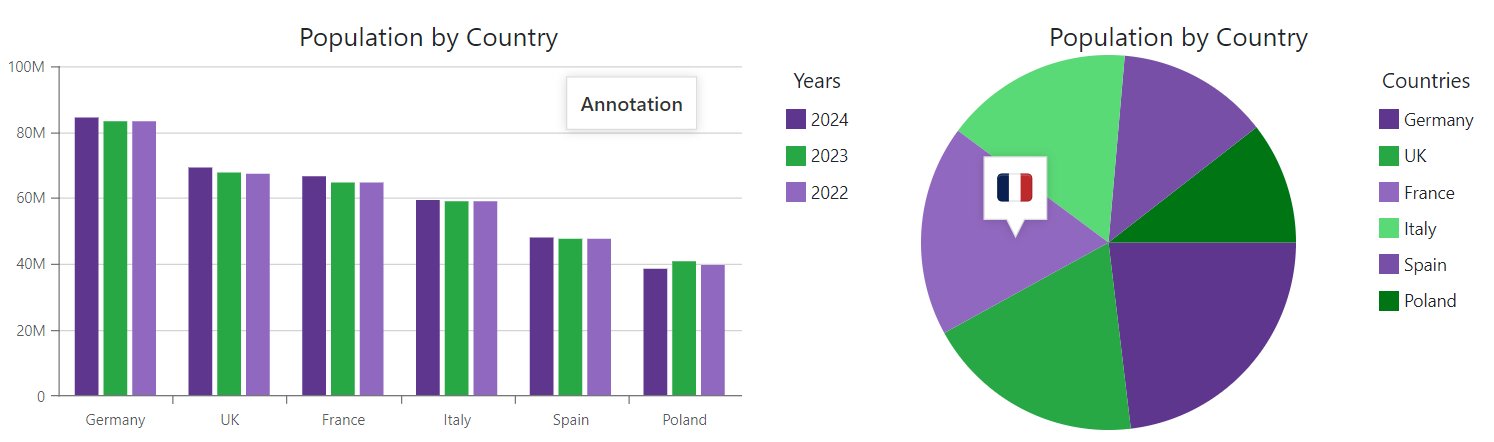
Descriptive Elements
To help users understand visualized data, you can add descriptive elements to your charts – a legend, titles and subtitles, tooltips, and annotations.
Customization
DevExpress Charts for Blazor allow you to customize the appearance of nested/inner components and chart elements. You can also apply a custom color palette and change the component font.
User Interaction Options
DevExpress Blazor Charts allow users to interact with their content: users can select, click, and hover over series and points.
Export
You can export chart content as an encoded string in a specified format (PNG, PDF, JPEG, and GIF).