Swift Plot
- 4 minutes to read
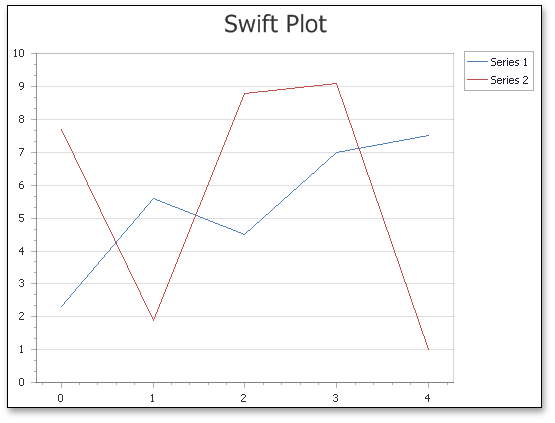
Short Description
The Swift Plot is represented by the SwiftPlotSeriesView object, which belongs to Point, Line and Spline Series Views.
This view is designed for quick series rendering, based on a scaled-down chart generation algorithm. The view is primarily used when you need to display a large amount of data points (10,000 or more) and/or to create a real-time chart that is updated by adding new points frequently (e.g., in milliseconds). Because this special algorithm improves performance, series of this view type can manage data display tasks better than any other view type.
Note that to maximize performance, the Swift Plot lacks the following elements and features that are typically available for other view types.
- Scale Breaks;
- Series Point Labels;
- Data Point Markers;
- The capability to rotate a diagram and reverse axes;
- Runtime series hit-testing;
- The WebChartControl.CustomDrawSeriesPoint event.
However, the Swift Plot includes important features such as panes, secondary axes, financial indicators and regression lines, and the WebChartControl.CustomDrawSeries event.
Chart Type Characteristics
Although the Swift Plot belongs to Point and Line series, it is not compatible with other views in this group, because it uses a special SwiftPlotDiagram type. The result is that you can only display the Swift Plot series within a single chart control, although this limitation does not restrict the number of Swift Plot series that can be used within the same chart (in either single or separate panes).
Note
Since the Swift Plot is designed to process numerical and date-time data, performance may decrease when the series SeriesBase.ArgumentScaleType property is set to Qualitative. For more information, refer to the following help topic: Series Scale Types.
A notable option available for series of this type is the SwiftPlotSeriesView.Antialiasing property, which allows you to enable smooth series drawing.
The table below lists the main characteristics of this chart type.
| Feature | Value |
|---|---|
| Series View type | SwiftPlotSeriesView |
| Diagram type | SwiftPlotDiagram |
| Number of arguments per series point | 1 |
| Number of values per series point | 1 |
Example
This example uses the SwiftPlotDiagram to improve performance when a large data set is displayed.
public partial class _Default : Page {
    protected void Page_Load(object sender, EventArgs e) {
        Series swiftPlotSeries = new Series {
            Name = "Swift Plot Series",
            View = new SwiftPlotSeriesView()
        };
        PopulateSeriesWithData(swiftPlotSeries, 100000);
        chartControl.Series.Add(swiftPlotSeries);

        SwiftPlotDiagram diagram = chartControl.Diagram as SwiftPlotDiagram;
        CustomizeSwiftPlotDiagram(diagram);
    }

    protected void CustomizeSwiftPlotDiagram(SwiftPlotDiagram diagram) {
        if (diagram == null) return;
        diagram.AxisX.Title.Visibility = DefaultBoolean.True;
        diagram.AxisX.Title.Text = "Point Number";
        diagram.AxisX.NumericScaleOptions.ScaleMode = ScaleMode.Manual;
        diagram.AxisX.NumericScaleOptions.MeasureUnit = NumericMeasureUnit.Custom;
        diagram.AxisX.NumericScaleOptions.CustomMeasureUnit = 1000;

        diagram.AxisX.NumericScaleOptions.AggregateFunction = AggregateFunction.Average;

        diagram.AxisY.Title.Visibility = DefaultBoolean.True;
        diagram.AxisY.Title.Text = "Point Value";
    }

    protected void PopulateSeriesWithData(Series series, int dataPoints) {
        Random rnd = new Random();
        for (int i = 0; i < dataPoints; ++i) {
            series.Points.Add(
                new SeriesPoint(
                    argument: i,
                    values: 2 * Math.Cos((double)i / dataPoints * 2 * Math.PI)
                          + Math.Sin((double)i / dataPoints * 2 * Math.PI)
                          + 4 * Math.Cos(2 * (double)i / dataPoints * 2 * Math.PI)
                          + 5 * Math.Sin(2 * (double)i / dataPoints * 2 * Math.PI)
                          + 0.6 * rnd.NextDouble() - 0.3
                )
            );
        }
    }
}
Tip
For the complete sample project, see the following DevExpress Support Center example: https://supportcenter.devexpress.com/ticket/details/e1836/chart-for-winforms-use-the-swiftplot-diagram-to-create-a-real-time-chart.