Swift Plot Diagram
- 3 minutes to read
You can use Swift Plot diagrams in the ASP.NET Chart Control to display a large number of data points. Before proceeding with this section, you may wish to review diagram fundamentals in the following topic: diagram.
This topic consists of the following sections.
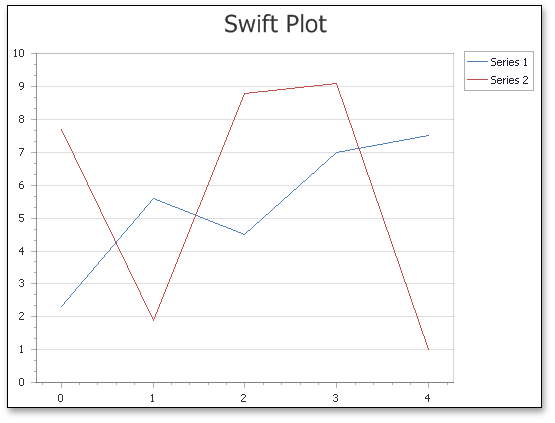
Swift Plot Overview
The SwiftPlotDiagram object is intended to plot series of only the SwiftPlotSeriesView type. The main purpose of this diagram type is to construct real-time charts in which points are added in a short period of time, and/or charts with a large number of points (tens of thousands and more). To meet these requirements, this diagram type is built upon an optimized algorithm (with fewer available features) to achieve the best performance.
Note that this diagram and its corresponding series view type support most features available for other 2D chart types such as multiple panes, secondary axes, financial indicators and regression lines. In most aspects, this diagram type is similar to the XY-Diagram type.
Refer to the following help topic to learn more about Swift Plot charts: Swift Plot.
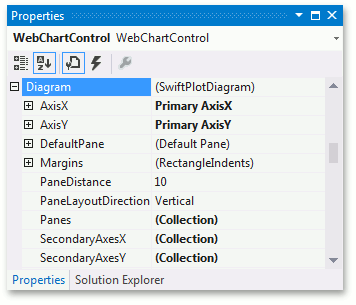
Accessing a Diagram
You can access the Swift Plot diagram’s options at design time. Click the chart to select it, and in the Properties window, expand the WebChartControl.Diagram property.
This example uses the SwiftPlotDiagram to improve performance when a large data set is displayed.
public partial class _Default : Page {
    protected void Page_Load(object sender, EventArgs e) {
        Series swiftPlotSeries = new Series {
            Name = "Swift Plot Series",
            View = new SwiftPlotSeriesView()
        };
        PopulateSeriesWithData(swiftPlotSeries, 100000);
        chartControl.Series.Add(swiftPlotSeries);

        SwiftPlotDiagram diagram = chartControl.Diagram as SwiftPlotDiagram;
        CustomizeSwiftPlotDiagram(diagram);
    }

    protected void CustomizeSwiftPlotDiagram(SwiftPlotDiagram diagram) {
        if (diagram == null) return;
        diagram.AxisX.Title.Visibility = DefaultBoolean.True;
        diagram.AxisX.Title.Text = "Point Number";
        diagram.AxisX.NumericScaleOptions.ScaleMode = ScaleMode.Manual;
        diagram.AxisX.NumericScaleOptions.MeasureUnit = NumericMeasureUnit.Custom;
        diagram.AxisX.NumericScaleOptions.CustomMeasureUnit = 1000;

        diagram.AxisX.NumericScaleOptions.AggregateFunction = AggregateFunction.Average;

        diagram.AxisY.Title.Visibility = DefaultBoolean.True;
        diagram.AxisY.Title.Text = "Point Value";
    }

    protected void PopulateSeriesWithData(Series series, int dataPoints) {
        Random rnd = new Random();
        for (int i = 0; i < dataPoints; ++i) {
            series.Points.Add(
                new SeriesPoint(
                    argument: i,
                    values: 2 * Math.Cos((double)i / dataPoints * 2 * Math.PI)
                          + Math.Sin((double)i / dataPoints * 2 * Math.PI)
                          + 4 * Math.Cos(2 * (double)i / dataPoints * 2 * Math.PI)
                          + 5 * Math.Sin(2 * (double)i / dataPoints * 2 * Math.PI)
                          + 0.6 * rnd.NextDouble() - 0.3
                )
            );
        }
    }
}