XRChart.CustomPaint Event
Allows you to draw custom graphics on top of the chart.
Namespace: DevExpress.XtraReports.UI
Assembly: DevExpress.XtraReports.v26.1.dll
Declaration
Event Data
The CustomPaint event's data class is CustomPaintEventArgs. The following properties provide information specific to this event:
| Property | Description |
|---|---|
| Bounds | Gets the bounds of a custom graphic object. |
| DXGraphics | |
| Graphics | Gets the custom graphic object. |
Remarks
You can handle the CustomPaint event to draw a line or graphical object over the chart rendered from the XRChart control.
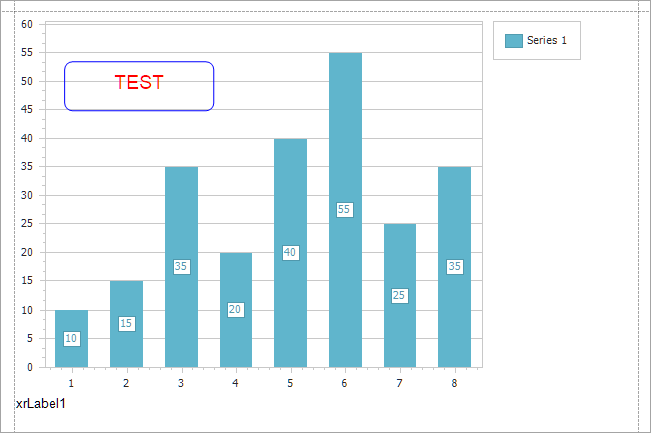
Example - Draw the Text in a Rectangle
The following code snippet draws a text string and a rectangle with rounded corners:
private void Chart_CustomPaint(object sender, CustomPaintEventArgs args) {
    GraphicsCache g = (args is DXCustomPaintEventArgs) ? ((DXCustomPaintEventArgs)args).Cache : new GraphicsCache(args.Graphics);
    g.DrawString("TEST", new DXFont("Arial", 14), new SolidBrush(DXColor.Red), new Point(100, 60));
    g.DrawRoundedRectangle(DXColor.Blue, 1, new Rectangle(50, 50, 150, 50), new CornerRadius(8));
}
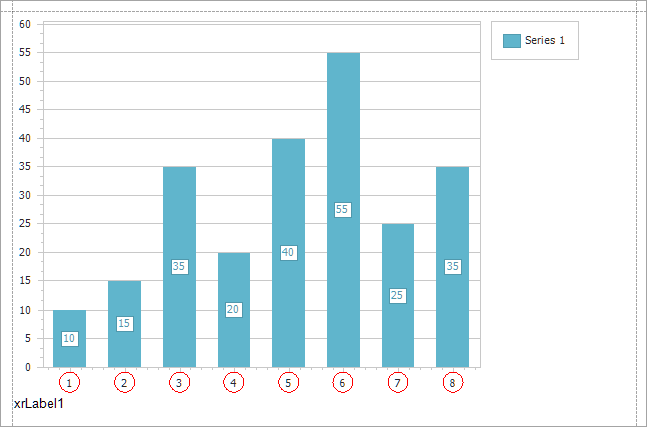
Example - Encircle Axis Values
You can use the XYDiagram2D.DiagramToPoint or RadarDiagram.DiagramToPoint methods in the CustomPaint event handler to draw custom graphic objects tied to the chart elements (series or series points).
The following code snippet encircles axis values in the chart:
private void Chart_CustomPaint(object sender, CustomPaintEventArgs e) {
    XYDiagram diagram = ((XRChart)sender).Diagram as XYDiagram;
    int leftInternalValue = Convert.ToInt32(Math.Ceiling(diagram.AxisX.VisualRange.MinValueInternal));
    int rightInternalValue = Convert.ToInt32(Math.Floor(diagram.AxisX.VisualRange.MaxValueInternal));
    double bottomYValue = (double)diagram.AxisY.VisualRange.MinValue;

    for (int i = leftInternalValue; i <= rightInternalValue; i++) {
        var axisValue = diagram.AxisX.GetScaleValueFromInternal(i);
        Point axisLabelCoordinates = diagram.DiagramToPoint(axisValue.ToString(), bottomYValue).Point;
        axisLabelCoordinates.Offset(-10, 5);

        e.Graphics.DrawEllipse(Pens.Red, axisLabelCoordinates.X, axisLabelCoordinates.Y, 20, 20);
    }
}
Note
The graphics drawn in the CustomPaint event handler will not affect 3D charts.