XRSparkline Class
A control that displays a compact chart for report data.
Namespace: DevExpress.XtraReports.UI
Assembly: DevExpress.XtraReports.v26.1.dll
Declaration
public class XRSparkline :
    XRControl,
    ISparklineSettings,
    ISparklineData,
    IDataContainer,
    IDataSourceAssignable,
    IDataContainerBase,
    IEffectiveDataContainer,
IXtraSupportCreateContentPropertyValueRemarks
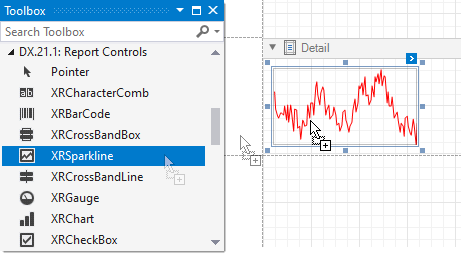
To add a sparkline to a report, drag the XRSparkline item from the DX:26.1: Report Controls Toolbox tab and drop the item onto the report.
Customize Appearance
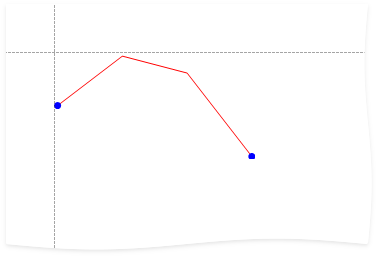
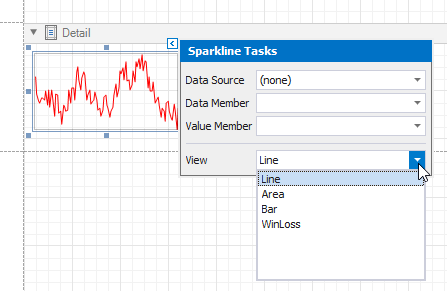
Use the sparkline’s View property to specify a chart’s view. Click the sparkline’s smart tag, expand the View drop-down list, and select a view.
| View | Example | View Options |
|---|---|---|
| Line |  |
LineSparklineView |
| Area |  |
AreaSparklineView |
| Bar |  |
BarSparklineView |
| WinLoss |  |
WinLossSparklineView |
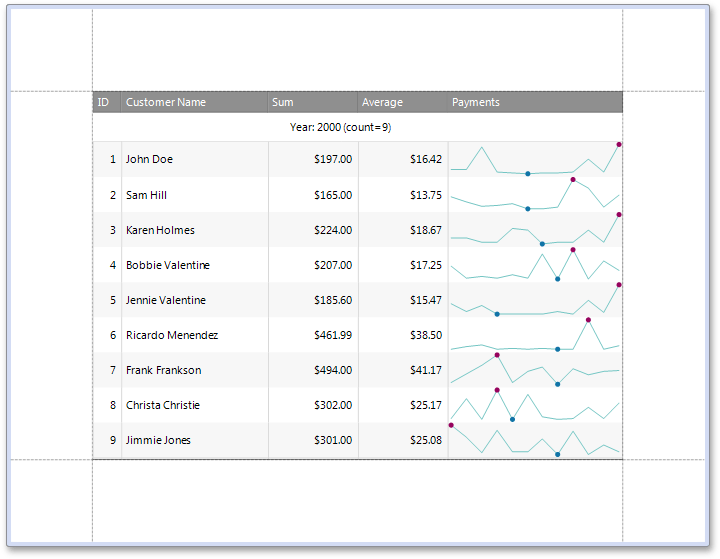
Use the view’s properties to customize the sparkline’s appearance. Each of the sparkline’s view has properties that define the visibility of extreme values:
The following image illustrates a table report that contains sparklines with maximum and minimum value indicators for each data range:
Bind to Data
To connect a sparkline to a data source, click the sparklines’s smart tag, expand the DataSource drop-down list, and select a data source.
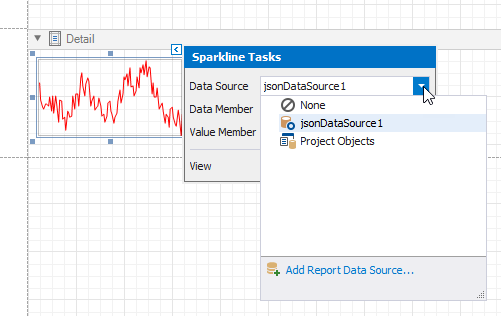
Then, specify the DataMember property and set the ValueMember property to a data field that supplies point values.
Note
If you do not specify the DataSource property, a sparkline uses the report’s data source.
Create a Sparkline in Code
The following example shows how to create a sparkline, customize it, and bind to data in code.
using DevExpress.DataAccess.Json;
using DevExpress.XtraReports.UI;
using DevExpress.Sparkline;
//...

string temperatures = "[{\"t\": 17}, {\"t\": 20}, {\"t\": 19}, {\"t\": 14}]";

// Create a sparkline and customize it.
var sparkline = new XRSparkline() {
    View = new LineSparklineView() {
        HighlightStartPoint = true,
        HighlightEndPoint = true,
        StartPointColor = System.Drawing.Color.Blue,
        EndPointColor = System.Drawing.Color.Blue
    }
};

// Bind the sparkline to a data source.
sparkline.DataSource = new JsonDataSource() {
    JsonSource = new CustomJsonSource(temperatures)
};
sparkline.ValueMember = "t";