Integrate the Pivot Grid with the Chart Control
- 12 minutes to read
Tip
You can use DevExpress BI Dashboard to build data visualization and analysis UIs that include Charts, Grids, Maps, Pivot Grids, Cards, Range Selectors, and other elements. This cross-platform product is available as a part of the DevExpress Universal Subscription.
Review the following help topic to learn the basics: Get Started with the DevExpress Dashboard.
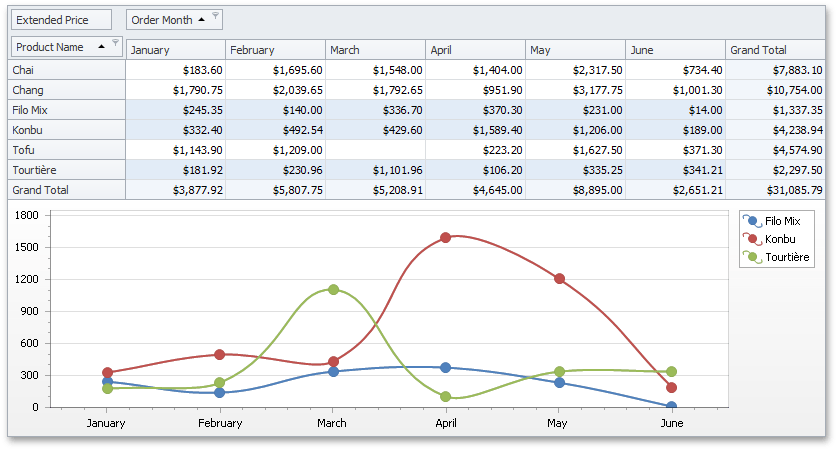
The Pivot Grid displays multidimensional data in a cross-tabular form, allowing users to perform various data shaping operations. They can customize the report to reshape data and get a layout that fits their specific data analysis needs.
Pivot Grid control allows end-users to go further and visualize data displayed in the pivot grid using the Chart Control.
This topic contains the following sections.
Binding Overview
The ChartControl retrieves data from the Pivot Grid control in the following manner.
- The series data member values are generated based on Pivot Grid control columns.
- The argument data member values are generated based on Pivot Grid control rows.
- The Value data member contains summary values.
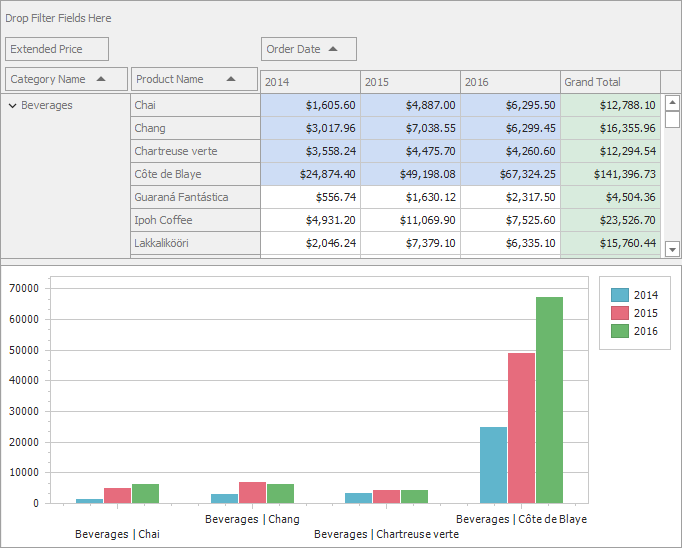
Series and argument data members are created based on column/row headers (e.g., ‘1994’, ‘Produce Total’, ‘Grand Total’). If a column/row is identified by multiple fields, the corresponding data member value is constructed from the respective field values connected by the ‘|’ sign (e.g., ‘1995 | January’, ‘Beverages | Chai’).
Implementation
To set a Pivot Grid control as the Chart control data source, do one of the following:
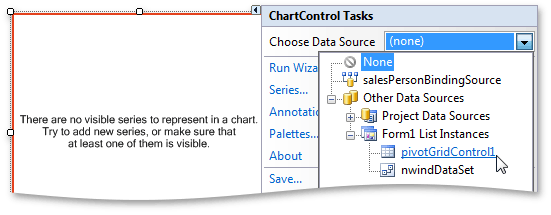
- At design-time
- Click the Chart control smart tag and select the PivotGridControl instance from the Choose Data Source drop-down list:
- In code
- Assign the PivotGridControl instance to the ChartControl.DataSource property.
The ChartControl visualizes data that is selected in the Pivot Grid control. To display all data in the Pivot Grid control, set the PivotGridOptionsChartDataSource.SelectionOnly property to false.
To change default behavior in order to create a series data member based on rows and an argument data member based on columns, set the PivotGridOptionsChartDataSourceBase.ProvideDataByColumns property to false.
Note
Use the PivotGridOptionsChartDataSourceBase.DataProvideMode property to control whether or not Pivot Grid control should pass to Chart control only values from the lowest detail level.
Binding and Layout Options
When the PivotGridControl instance is assigned to the ChartControl.DataSource property, chart bindings and layout are auto-adjusted. If necessary, you can manually specify ChartControl binding settings that define how to create a diagram from supplied data.
There are two modes of providing binding settings to ChartControl: automatic and manual. Use the PivotGridDataSourceOptions.AutoBindingSettingsEnabled property to switch between these modes.
- Automatic mode
- In this mode (the PivotGridDataSourceOptions.AutoBindingSettingsEnabled property is set to true), binding settings are automatically adjusted. In this instance, the Chart control uses data source series, argument and value data members to create series, arguments and values, respectively. You can handle the ChartControl.CustomizeAutoBindingSettings event to manually adjust automatically applied binding settings. This event occurs after automatic settings have been applied to a chart data source.
- Manual mode
- In this mode (when the PivotGridDataSourceOptions.AutoBindingSettingsEnabled property is set to false), you need to use the ChartControl.SeriesDataMember property to specify which data member should be used to create series. Then, use the SeriesBase.ArgumentDataMember and SeriesBase.ValueDataMembers properties of the ChartControl.SeriesTemplate object to specify which data members should be used to create arguments and values, respectively. Use the ‘Series’, ‘Arguments’, and ‘Values’ strings to refer to corresponding data members stored in the data source.
When binding settings are applied, you can manually specify layout settings that define how to display a diagram. As with binding settings, you can let ChartControl adjust these settings automatically (in this instance, you can manually customize them by handling various events) or specify them manually. Use the PivotGridDataSourceOptions.AutoLayoutSettingsEnabled property to specify whether or not layout settings are automatically adjusted.
For a list of binding and layout settings, see the Pivot Charting topic in the XtraCharts Suite documentation.
Data Types Specifics
If a Pivot Grid control contains multiple data fields with different data types (PivotGridField.DataType), cell values are converted to Decimal (if possible). Use the PivotGridOptionsChartDataSourceBase.ProvideCellValuesAsType property to override this behavior by explicitly specifying a data type to which cell values should be converted.
Chart control supports only Numeric and DateTime series point values (see Series Scale Types to learn more). To convert cell values into an appropriate type in a custom manner, handle the PivotGridControl.CustomChartDataSourceData event.
When choosing a Chart type, note that only Series with a single value per Series point are supported.
Export
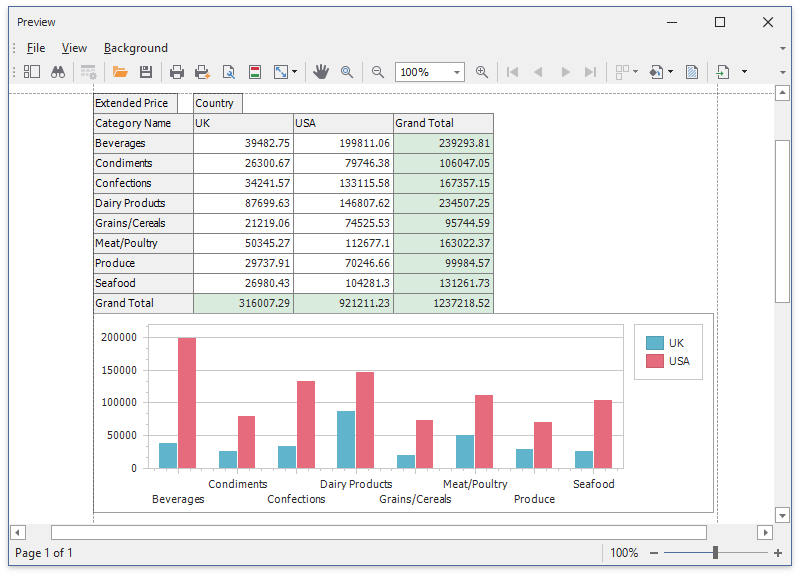
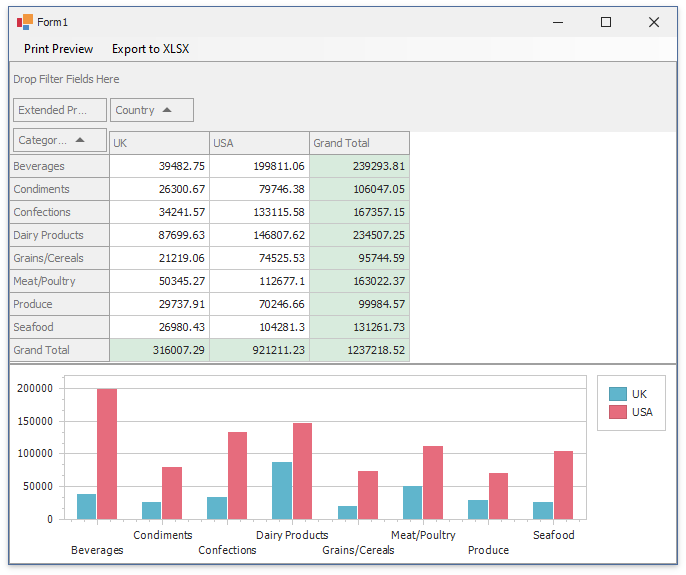
The following example shows how to print a document that contains a Pivot Grid control with an integrated Chart:
Create the
CreateCompositeLinkmethod that returns a CompositeLink object.CompositeLinkcombines different printing links into one document, shows its print preview, and prints or exports the resulting document. Create two PrintableComponentLink objects for the Pivot and Chart controls, and add these objects to the link collection to combine them inCompositeLink.using DevExpress.XtraCharts; using DevExpress.XtraPivotGrid; using DevExpress.XtraPrinting; using DevExpress.XtraPrintingLinks; using System; using System.Windows.Forms; namespace WinFormsExport { public partial class Form1 : DevExpress.XtraEditors.XtraForm { public Form1() { // ... } // ... private CompositeLink CreateCompositeLink(PivotGridControl pivotGridControl1, ChartControl chartControl1) { PrintableComponentLink pivotLink = new PrintableComponentLink(); pivotLink.Component = pivotGridControl1; PrintableComponentLink chartLink = new PrintableComponentLink(); chartLink.Component = chartControl1; CompositeLink compositeLink = new CompositeLink(new PrintingSystem()); compositeLink.Links.AddRange(new object[] { pivotLink, chartLink }); return compositeLink; // ... } }Add the MenuStrip control to the form. Create two
toolStripMenuItemobjects and handle theirClickevents. Call theShowPreviewandExportToXlsxmethods of the composite link in theClickevent handlers.using DevExpress.XtraCharts; using DevExpress.XtraPivotGrid; using DevExpress.XtraPrinting; using DevExpress.XtraPrintingLinks; using System; using System.Windows.Forms; namespace WinFormsExport { public partial class Form1 : DevExpress.XtraEditors.XtraForm { public Form1() { InitializeComponent(); ToolStripMenuItem toolStripMenuItem1 = new ToolStripMenuItem(); ToolStripMenuItem toolStripMenuItem2 = new ToolStripMenuItem(); menuStrip1.Items.AddRange(new ToolStripItem[] { toolStripMenuItem1, toolStripMenuItem2 }); toolStripMenuItem1.Name = "Print Preview"; toolStripMenuItem1.Text = "Print Preview"; toolStripMenuItem2.Name = "Export to XLSX"; toolStripMenuItem2.Text = "Export to XLSX"; toolStripMenuItem1.Click += toolsToolStripMenuItem2_Click; toolStripMenuItem2.Click += toolsToolStripMenuItem_Click; // This line of code is generated by Data Source Configuration Wizard // Fill the ExcelDataSource asynchronously excelDataSource1.FillAsync(); } // ... private void toolsToolStripMenuItem_Click(object sender, EventArgs e) { SaveFileDialog saveFileDialog1 = new SaveFileDialog(); saveFileDialog1.Filter = "Excel Workbook|*.xlsx"; saveFileDialog1.ShowDialog(); if (saveFileDialog1.FileName != "") { CompositeLink compositeLink = CreateCompositeLink(pivotGridControl1, chartControl1); compositeLink.ExportToXlsx(saveFileDialog1.FileName); } } private void toolsToolStripMenuItem2_Click(object sender, EventArgs e) { CompositeLink compositeLink = CreateCompositeLink(pivotGridControl1, chartControl1); compositeLink.ShowPreview(); } } }
Run the application and use the Print Preview and Export to XLSX commands to print a document that contains both controls:
API
The Pivot Grid control has multiple options you can use to specify how the ChartControl interprets data. You can use the PivotGridControl.OptionsChartDataSource property to access these settings stored in a PivotGridOptionsChartDataSource object.
- PivotGridOptionsChartDataSourceBase.ProvideDataByColumns
- Gets or sets whether series in a chart control are created for PivotGrid columns or rows.
- PivotGridOptionsChartDataSource.SelectionOnly
- Gets or sets whether a chart control must display selected cells or all the data of the PivotGrid control.
- PivotGridOptionsChartDataSourceBase.ProvideEmptyCells
- Gets or sets whether empty cells should be processed by the Chart control.
- PivotGridOptionsChartDataSourceBase.DataProvideMode
- Gets or sets what data the pivot grid should pass to a bound chart control.
- PivotGridOptionsChartDataSourceBase.ProvideColumnCustomTotals
- Gets or sets whether column custom totals should be passed to a chart control.
- PivotGridOptionsChartDataSourceBase.ProvideColumnGrandTotals
- Gets or sets whether column grand totals are passed to a chart control.
- PivotGridOptionsChartDataSourceBase.ProvideRowCustomTotals
- Gets or sets whether row custom totals should be displayed in a chart control.
- PivotGridOptionsChartDataSourceBase.ProvideRowGrandTotals
- Gets or sets whether row grand totals are passed to a chart control.
- PivotGridOptionsChartDataSourceBase.ProvideRowTotals
- Gets or sets whether row totals are passed to a chart control.
- PivotGridOptionsChartDataSourceBase.FieldValuesProvideMode
- Gets or sets how field values are passed to the chart control.
- PivotGridOptionsChartDataSourceBase.ProvideCellValuesAsType
- Gets or sets the type to which cell values are converted, before they are exported to the Chart Control.
- PivotGridOptionsChartDataSourceBase.ProvideColumnFieldValuesAsType
- Gets or sets the type to which the column field values are converted before they are exported to the chart control.
- PivotGridOptionsChartDataSourceBase.ProvideRowFieldValuesAsType
- Gets or sets the type to which the row field values are converted, before they are exported to the chart control.
- PivotGridOptionsChartDataSourceBase.MaxAllowedPointCountInSeries
- Gets or sets the maximum number of points allowed in a series.
- PivotGridOptionsChartDataSourceBase.MaxAllowedSeriesCount
- Gets or sets the maximum number of series allowed in the chart data source.
- PivotGridOptionsChartDataSource.UpdateDelay
- Gets or sets the delay between changing the cell focus or selection, and updating the bound Chart control.
Note
Note that PivotGridOptionsChartDataSourceBase.Provide…Totals properties are in effect when the PivotGridOptionsChartDataSourceBase.DataProvideMode is set to the PivotChartDataProvideMode.UseCustomSettings.
Examples
Visualize Pivot Grid Data in the Chart Control
The following example shows how to integrate the Pivot Grid with the Chart control. The PivotGridControl instance is assigned to the ChartControl.DataSource property that allows the Chart to load and visualize data directly from the Pivot Grid.
using System;
using System.Windows.Forms;

namespace XtraPivotGrid_ChartsIntegration {
    public partial class Form1 : Form {
        public Form1() {
            InitializeComponent();
            // This line of code is generated by Data Source Configuration Wizard
            // Fill the SqlDataSource asynchronously
            sqlDataSource1.FillAsync();
        }
        private void Form1_Load(object sender, EventArgs e) {
            // Sets the PivotGridControl as a data source for the ChartControl.
            chartControl1.DataSource = pivotGridControl1;
        }
    }
}
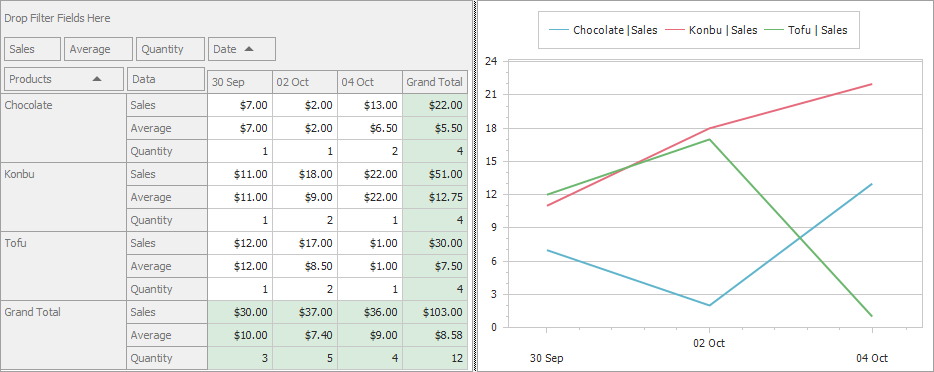
Hide Unnecessary Series from the Chart
This example demonstrates how to handle the PivotGridControl.CustomChartDataSourceRows event to hide unnecessary series from the Chart control connected to the Pivot Grid.
using System;
using System.Data;
using System.Windows.Forms;

namespace WindowsApplication53 {
    public partial class Form1 : Form {
        public Form1() {
            InitializeComponent();
        }
        private void Form1_Load(object sender, EventArgs e) {
            PopulateTable();
            pivotGridControl1.RefreshData();
            pivotGridControl1.BestFit();
            pivotGridControl1.BestFitDataHeaders(true);
            chartControl1.SeriesTemplate.ChangeView(DevExpress.XtraCharts.ViewType.Line);
        }
        private void PopulateTable() {
            DataTable myTable = dataSet1.Tables["Data"];
            myTable.Rows.Add(new object[] {"Chocolate", DateTime.Today, 7});
            myTable.Rows.Add(new object[] {"Chocolate", DateTime.Today.AddDays(4), 6 });
            myTable.Rows.Add(new object[] {"Tofu", DateTime.Today, 12 });
            myTable.Rows.Add(new object[] {"Tofu", DateTime.Today.AddDays(2), 14 });
            myTable.Rows.Add(new object[] {"Konbu", DateTime.Today, 11 });
            myTable.Rows.Add(new object[] {"Konbu", DateTime.Today.AddDays(2), 10 });

            myTable.Rows.Add(new object[] {"Chocolate", DateTime.Today.AddDays(4), 7 });
            myTable.Rows.Add(new object[] {"Chocolate", DateTime.Today.AddDays(2), 2 });
            myTable.Rows.Add(new object[] {"Tofu", DateTime.Today.AddDays(2), 3 });
            myTable.Rows.Add(new object[] {"Tofu", DateTime.Today.AddDays(4), 1 });
            myTable.Rows.Add(new object[] {"Konbu", DateTime.Today.AddDays(2), 8 });
            myTable.Rows.Add(new object[] {"Konbu", DateTime.Today.AddDays(4), 22 });
        }

        private void pivotGridControl1_CustomChartDataSourceRows(object sender,
            DevExpress.XtraPivotGrid.PivotCustomChartDataSourceRowsEventArgs e) {
            for (int i = e.Rows.Count  - 1; i >= 0; i--) {
                if (!Object.Equals( e.Rows[i].RowValueInfo.DataField,  fieldValue) )
                    e.Rows.RemoveAt(i);
            }
        }
    }
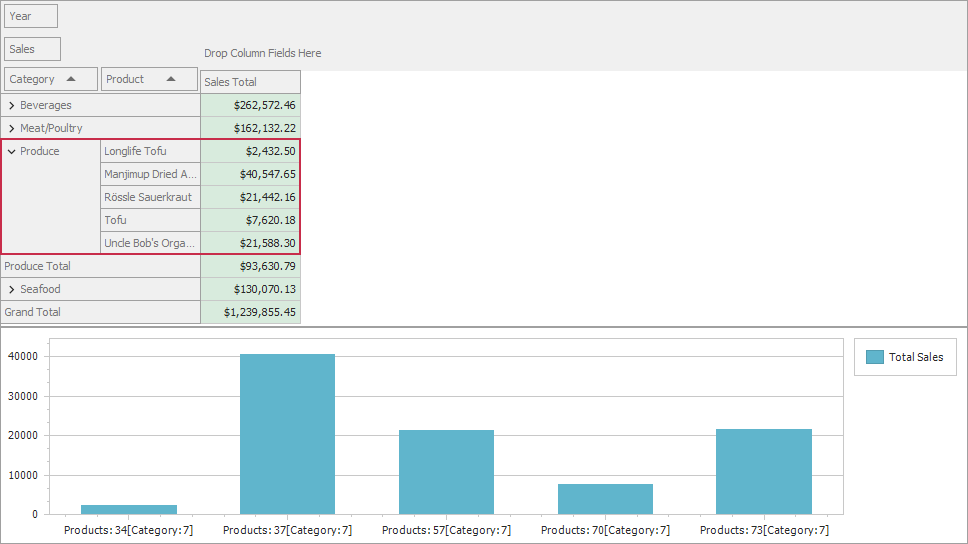
Customize Pivot Grid Data before Displaying it in the Chart Control
The following example demonstrates how to add custom text to the Pivot Grid’s data used as the data source for the Chart control. The Pivot Grid supplies data to the attached Chart control in the form of a simple table. In the image below, the Chart axis labels display the number of unique values that are stored in the underlying data source in the Product Name and Category fields.
#region #CustomChartDataSourceData
private void pivotGridControl1_CustomChartDataSourceData(object sender,
PivotCustomChartDataSourceDataEventArgs e) {
    if(e.ItemType == PivotChartItemType.RowItem) {
        if(e.FieldValueInfo.Field == fieldCategoryName) {
            e.Value = CategoryEncodeTable[e.FieldValueInfo.Value.ToString()];
        } else if(e.FieldValueInfo.Field == fieldProductName) {
            string product =
                ProductEncodeTable[e.FieldValueInfo.Value.ToString()];
            string category =
            CategoryEncodeTable[e.FieldValueInfo.GetHigherLevelFieldValue(fieldCategoryName).ToString()];
            e.Value = product + '[' + category + ']';
        }
    }
    if(e.ItemType == PivotChartItemType.ColumnItem) {
        if(e.FieldValueInfo.ValueType == PivotGridValueType.GrandTotal) {
            e.Value = "Total Sales";
        }
    }
    if(e.ItemType == PivotChartItemType.CellItem) {
        e.Value = Math.Round(Convert.ToDecimal(e.CellInfo.Value), 0);
    }
}
#endregion #CustomChartDataSourceData