Define an Appearance for Painting All Visual Elements
This document describes the easiest way to change a chart’s overall look and feel - by choosing one from the built-in appearances.
In XtraCharts, numerous built-in appearance presets are available, that define the look of all the chart’s key elements - its diagram, axes, legend, series, and so on.
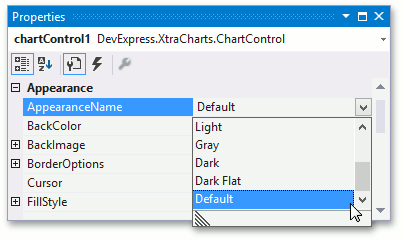
A chart’s appearance is determined by the ChartControl.AppearanceName property, and the list of its presets is returned by the ChartControl.GetAppearanceNames method.
The following images demonstrate a chart with two different appearances.
| The property’s value | Resulting image |
|---|---|
| ChartControl.AppearanceName = Light | 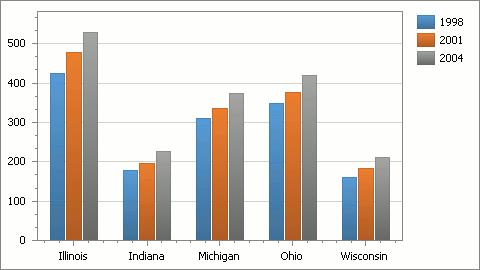 |
| ChartControl.AppearanceName = Gray | 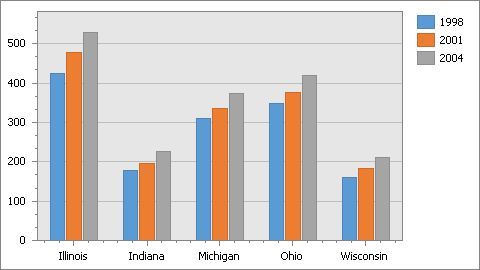 |
When an appearance is defined, it’s often required to individually paint each series, or each point within a series (e.g. for a Bar series), and define a palette that is used to paint them. This is described in the next section of this document.
For a step-by-step tutorial, refer to How to: Customize a Chart’s Appearance.
Note
In addition, you can enable your end-users to specify palettes and appearance for a chart themselves. Refer to the Chart Ribbon and Toolbars help topic for more information.