Manually Add Points to a Series
- 4 minutes to read
This document explains how to populate a series with data points manually. This approach is useful when the chart should display a small number of points with known arguments and values. Note that data can be provided in this manner for manually created series only.
Important
The Chart Control does not display a Series unless it has any points.
Add Series Points at Design Time
The series can be populated with series points using one of the following ways:
Using the Chart Designer
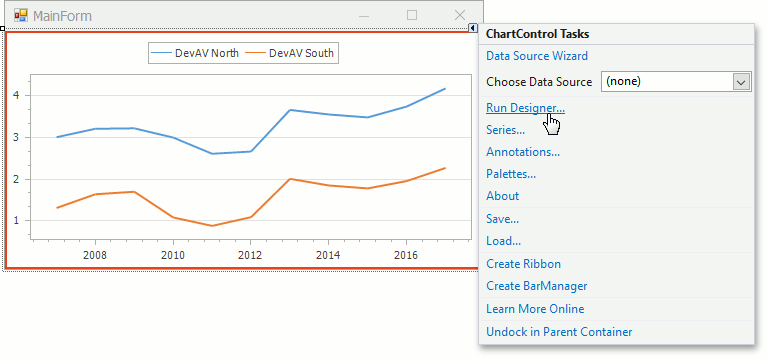
The Chart Designer provides the capability to configure a variety of chart elements including the Series’s point collection. Select the Chart Control, click its smart tag then click the Run Designer… item to invoke the Designer.
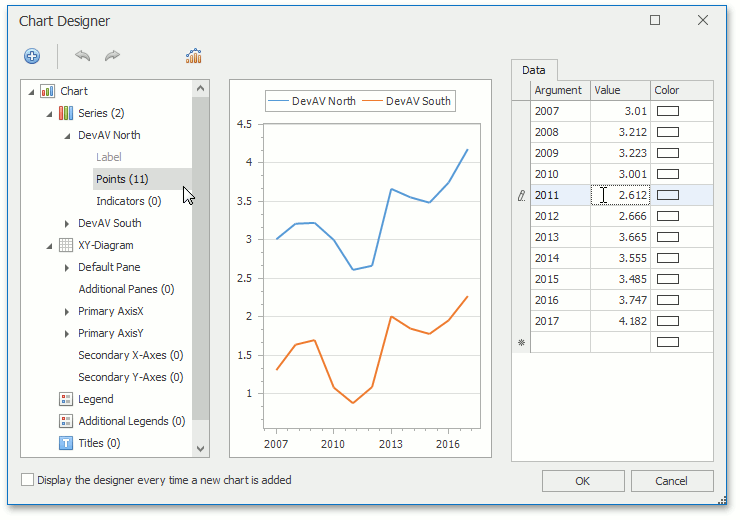
Expand the required series elements in the Chart Structure Tree and select the Points element. You can manage series points in the Data panel. Note that for several series view types (for example, Bubble and Financial Views), each point should have two or four values.
Using the Series Collection Editor
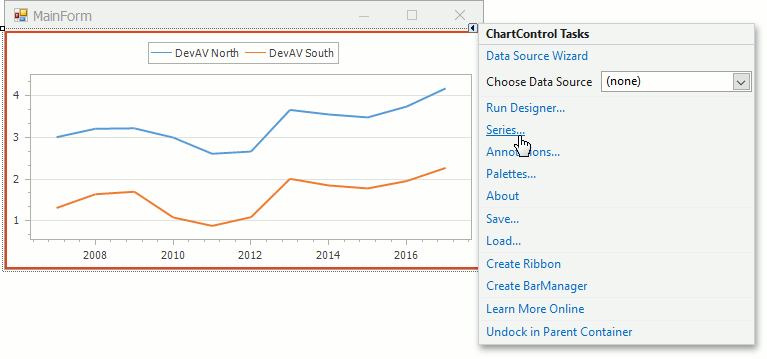
The Series Collection Editor manages a series’ point collection as well as the chart’s series collection. Click the Chart Control’s smart tag, then click Series… to invoke the Editor…
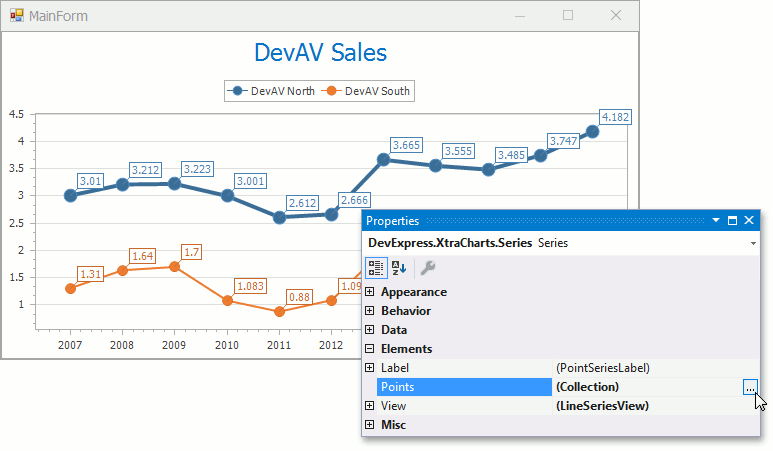
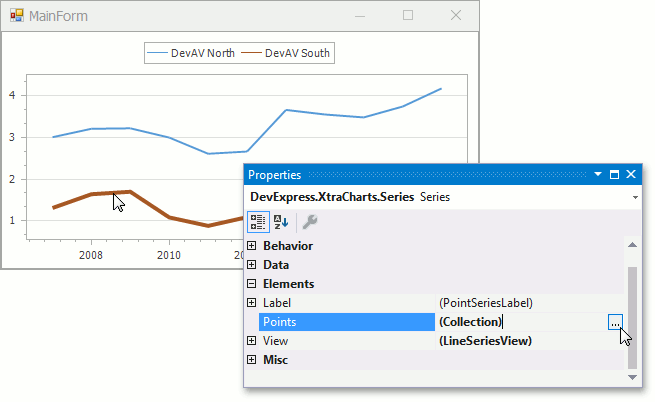
… or select the series, locate the Series.Points property’s ellipsis button to invoke the Editor and the selected in the Chart Control series will be pre-selected in the Editor.
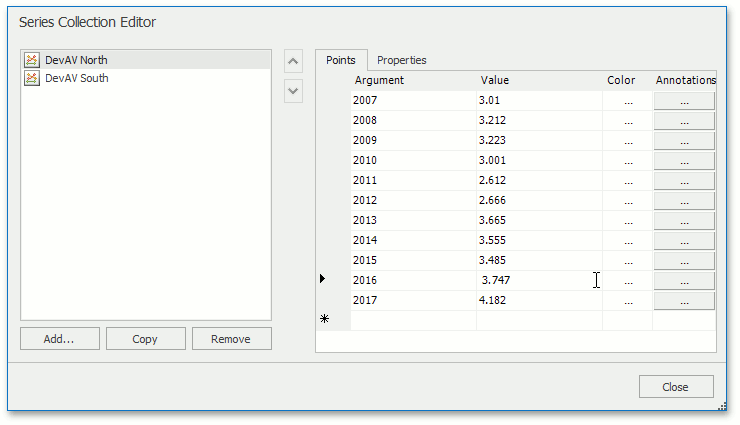
In the Editor dialog, select a series on the left side, and in the Points tab, create points specifying arguments and their corresponding values. Note that for several series view types (for example, Bubble and Financial Views) each point should have two or four values.
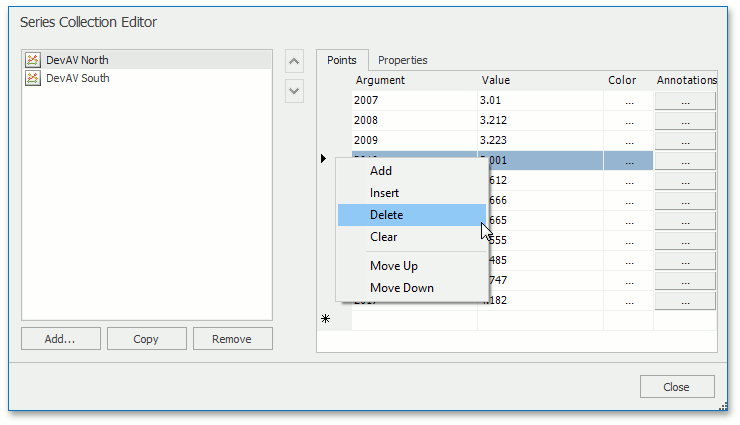
Right-click a point’s row, and in the invoked menu, select Delete to remove the point. This menu also allows you to insert and reorder points.
The default SeriesBase.ArgumentScaleType property value (Auto) specifies that the series uses series point arguments to specify its argument’s scale type. Refer to the Series Scale Types topic to learn how to change the default scale types.
Refer to Series for more information about series options.
Add Series Points at Runtime
The series’s point collection can be populated at runtime using the following approach:
Series northSeries = chartControl.Series["DevAV North"];
northSeries.Points.AddRange(
    new SeriesPoint(2007, 3.01),
    new SeriesPoint(2008, 3.212),
    new SeriesPoint(2009, 3.223),
    // and another points.
);
// The Points collection provides  Add...Point methods
// that allow you to add series points for different view types.
northSeries.Points.AddPoint(2011, 2.612);
northSeries.Points.AddBubblePoint(2011, 2.612, 1.0);
The following table lists the properties and methods in the code snippets above:
| Symbol | Description |
|---|---|
| Series.Points | Gets the series’ collection of data points. |
| SeriesPointCollection.Add | Appends the specified SeriesPoint object to the current collection. |
| SeriesPointCollection.AddRange | Appends an array of series points to the collection. |
| SeriesPointCollection.AddPoint | Adds a point with the specified argument and value required to plot a series. |
| SeriesPointCollection.AddBubblePoint | Adds a point with the specified argument and values required to plot a series with a bubble series view. |
| SeriesPointCollection.AddRangePoint | Adds a point with the specified argument and values required to plot a series with a range series view. |
| SeriesPointCollection.AddGanttPoint | Adds a point with the specified argument and values required to plot a series with a Gantt series view. |
| SeriesPointCollection.AddFinancialPoint | Adds a point with the specified argument and values required to plot a series with a financial series view. |
| SeriesPointCollection.AddBoxPlotPoint | Adds a point with the specified argument and values required to plot a series with a Box Plot series view. |