Hierarchical Value Presentation
- 3 minutes to read
The Pivot Grid component can display data hierarchically at multiple detail levels in a single report. Multi-level hierarchies allow users to manage the Pivot Grid’s layout and how detailed data should be in a report.
For example, you can drop existing fields onto one area to create additional fields with different detail levels. Once a hierarchy is generated, you can join fields in a continuous group to allow users to interact with it as a single field.
The following sections describe how to use data detail levels for different scenarios:
Transform Master-Detail Relationships into a Hierarchy
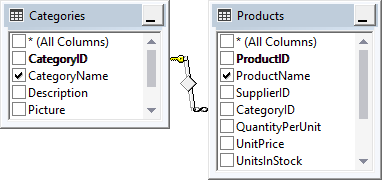
A hierarchy can enhance a report when source data contains several tables. For example, in the image below, the Categories table joined with Products table by the CategoryID field. In this case, you can create a virtual table (view) as a container for the CategoryName and ProductName fields from joined tables in the database.
You can drop two fields onto the column or row area to display the Category → Product hierarchy on an axis. Users can browse data summarized by categories and view details for each product within a report.
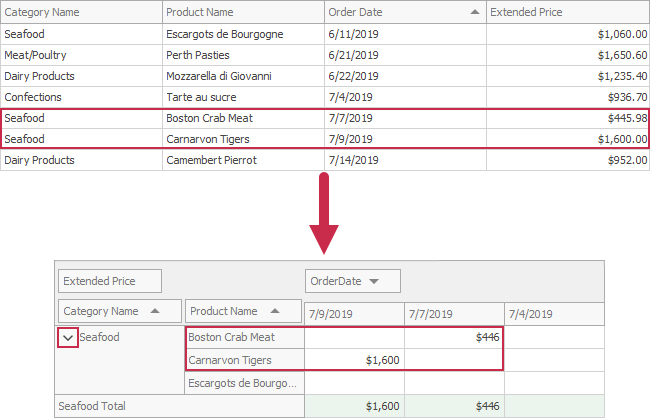
The parent value (Seafood) displays the expand button that allows users to switch between the “by Product” and “by Category” views. Alternatively, they can use the built-in field value context menu. As a result, a single report can display both raw and sorted data.
Apply Different Levels of Detail to the Same Field
You can combine unique values of a data field into groups. For example, use group intervals if you have sales records for each day, and you want to show the total sales for a year. The following list contains group interval examples:
- Numeric
-
- Date-Time
-
- Alphabetical
-
As a result, you can have several fields bound to the same data field with different detail levels. Refer to Grouping for more information about predefined and custom group intervals.
To implement a Year → Quarter → Month hierarchy from a Date-Time field, do the following:
- Create a field and drop it on the row or column area.
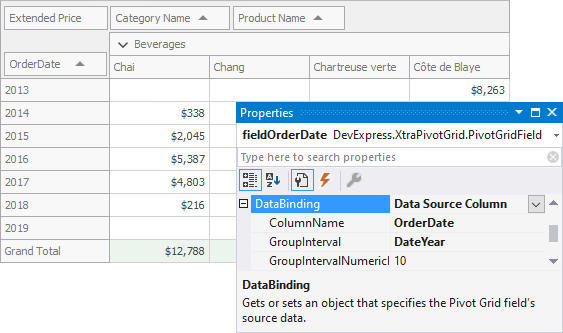
Open the field’s smart tag menu or the Properties grid and specify the FieldName and GroupInterval properties (ColumnName and GroupInterval in Optimized mode).
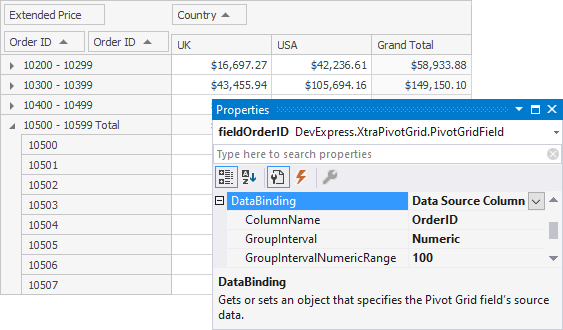
The image below shows the Year field with the specified OrderDate source field and the DateYear group interval:
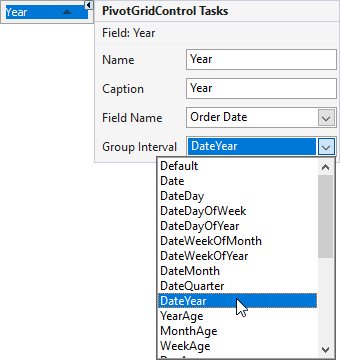
The following fields implement the Year → Quarter → Month hierarchy:
- Year
- Group Interval: DateYear
- Data Source Field: OrderDate
- Quarter
- Group Interval: DateQuarter
- Data Source Field: OrderDate
- Month
- Group Interval: DateMonth
- Data Source Field: OrderDate
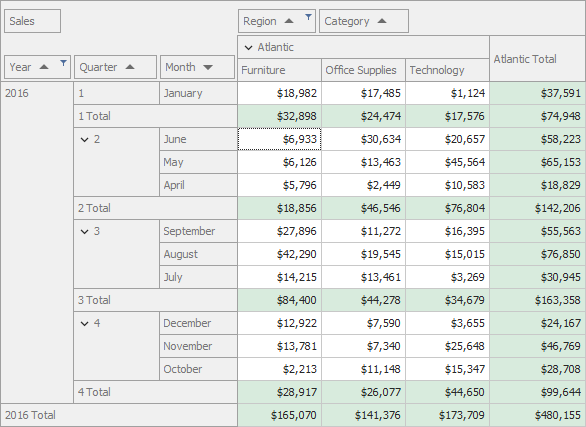
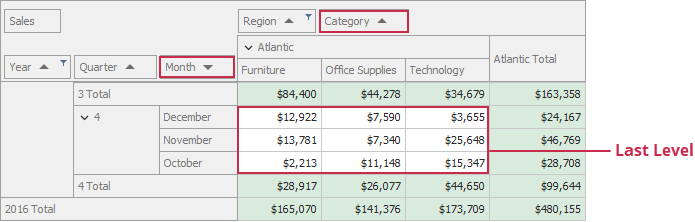
The image below shows the resulting hierarchy:
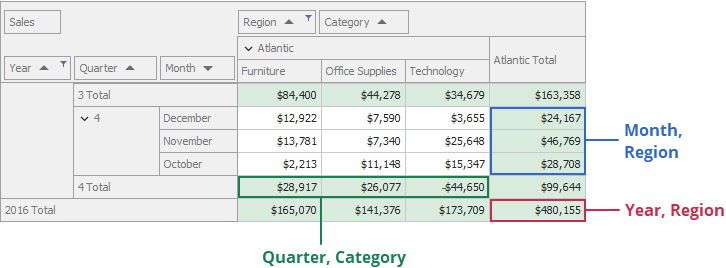
Use Resulting Detail Levels
Hierarchy fields, located in row and column areas form different levels of data detail. A pair of column and row fields defines the visual detail level. Cells that display values of these fields belong to the same detail level if they are located at the intersections of columns and rows.
You can use different detail levels to apply summary filter or conditional formatting rules. For example, the initial summary filter applies to the last level’s cells. Set the PivotSummaryFilter.Mode property one of the following values to change the detail level:
- Last Level
- The intersection of the last fields in the column and row areas defines the last level of detail.
- Specific Level
- A user specifies column and row fields. The image below shows detail levels defined by different field combinations: