Display Data from WinForms Controls in a Chart
- 2 minutes to read
Tip
Use the DevExpress BI Dashboard to build cross-platform data visualization UIs with Charts, Grids, Maps, Pivot Grids, Range Selectors, and other visualization components. BI Dashboard ships as part of the DevExpress Universal Subscription.
The ChartControl can display data from the following controls:
Bind Chart at Design Time
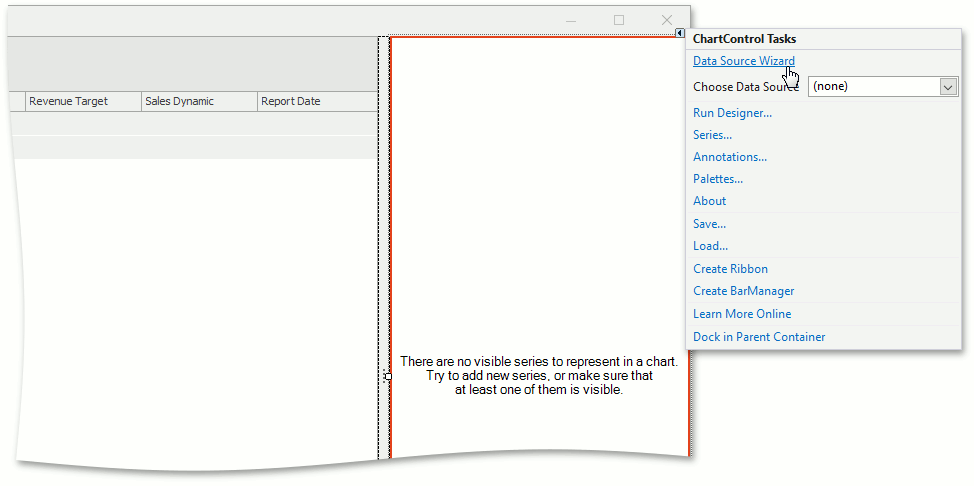
- Select the Chart Control.
Open the Smart Tag menu and click Data Source Wizard:
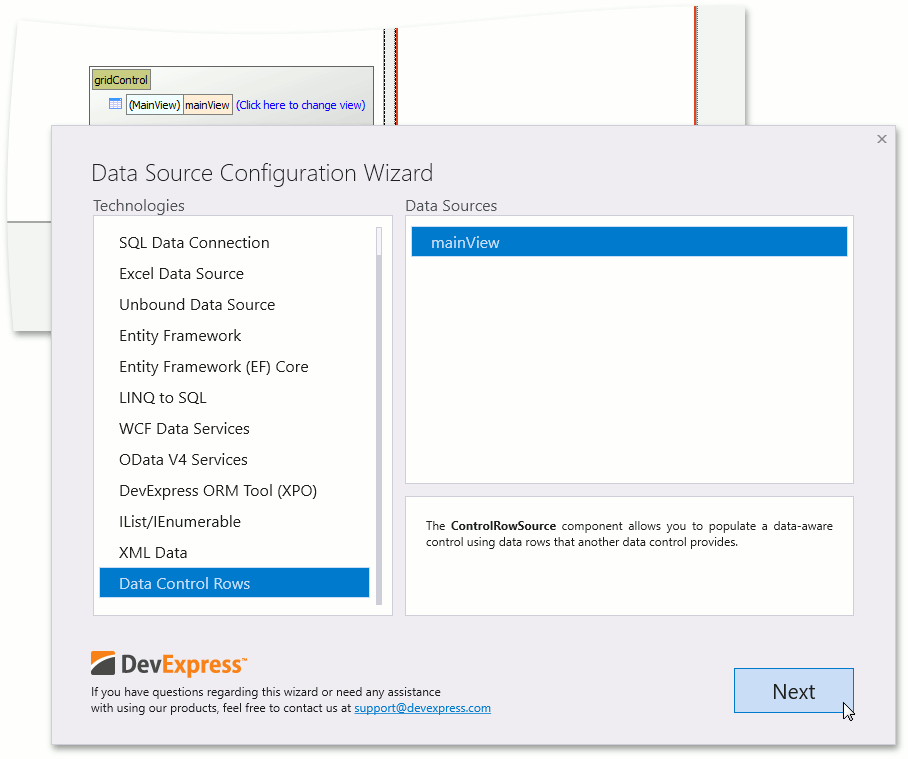
In the Wizard, select the Data Control Rows technology and the source control. Click Next:
Select the type of rows to visualize (for example, a
GridView):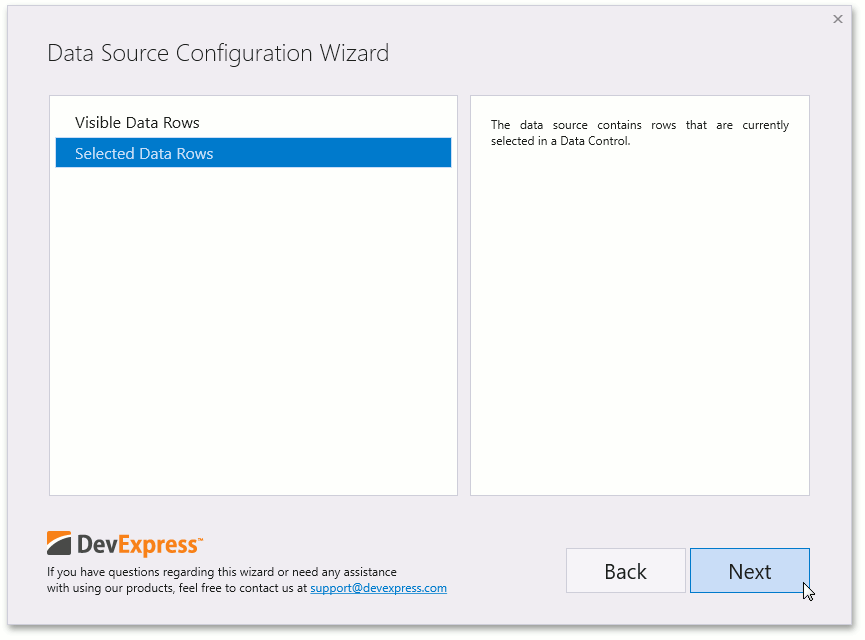
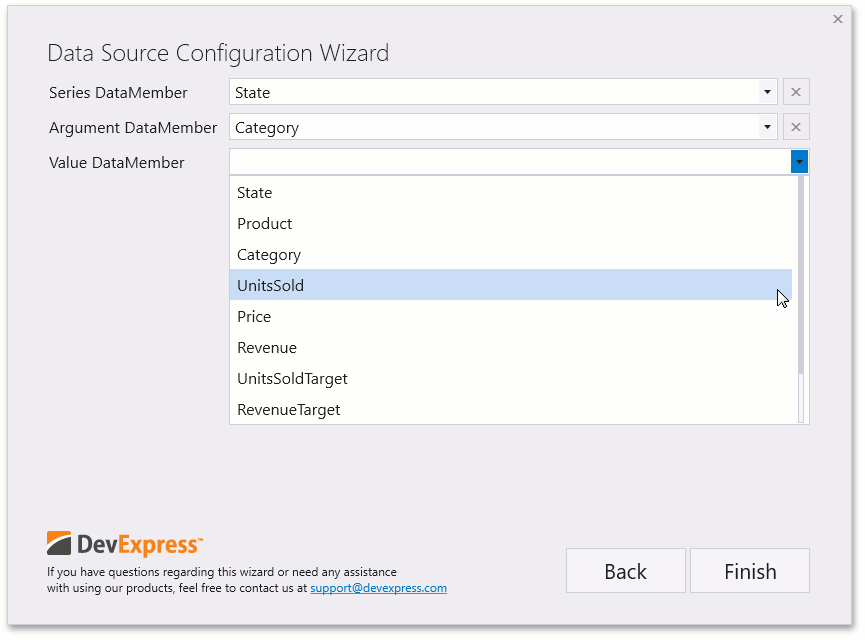
Map the following chart members to data fields:
- Series Member
- Argument Member
- Value Member
Click Finish and run the project. The following screenshot shows the
ChartControlthat visualizes grid data: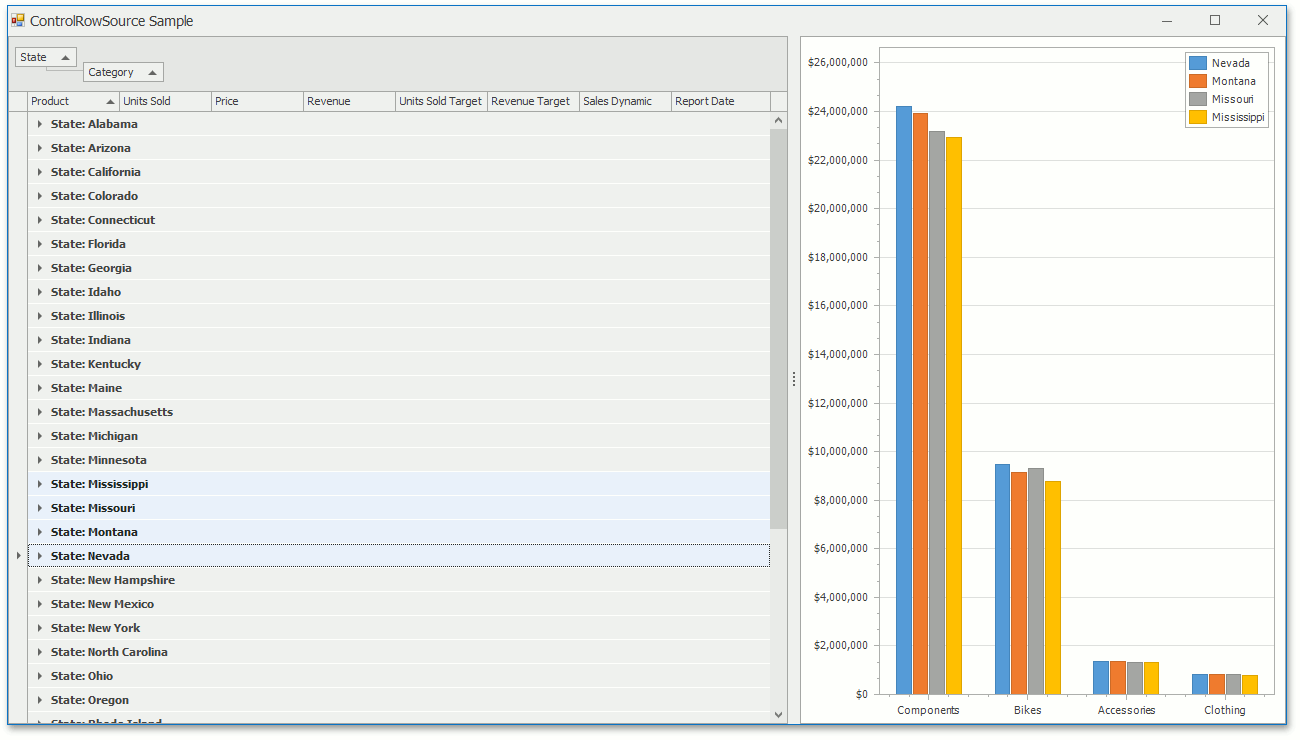
Note
The Data Source Wizard automatically adds a ControlRowSource component and binds it to the ChartControl.DataSource property. The ControlRowSource component is not available in the Toolbox.
Bind Chart at Runtime
- Create a new instance of the ControlRowSource class.
- Initialize Control and ControlRows properties.
- Assign the
ControlRowSourceobject to the ChartControl.DataSource property. - Map the Chart Control’s
SeriesDataMember,ArgumentDataMember, andValueDataMembersproperties to data fields.
// Bind the chart to visible rows in the grid.
chartControl.DataSource = new DevExpress.Data.Controls.ControlRowSource() {
    Control = mainView,
    ControlRows = DevExpress.Data.Controls.ControlRows.Visible
};

// Group series by 'State'.
chartControl.SeriesDataMember = "State";

// Set argument and value bindings.
chartControl.SeriesTemplate.ArgumentDataMember = "Category";
chartControl.SeriesTemplate.ValueDataMembers.AddRange("Revenue");