HeatmapControl.DataAdapter Property
Gets or sets an adapter that is used to load data to the heatmap.
Namespace: DevExpress.Xpf.Charts.Heatmap
Assembly: DevExpress.Xpf.Charts.v26.1.dll
Declaration
Property Value
| Type | Description |
|---|---|
| HeatmapDataAdapterBase | A HeatmapDataAdapterBase descendant. |
Remarks
The Heatmap Control uses data adapters to load data. Heatmap data adapters are derived from the HeatmapDataAdapterBase class. Use the Heatmap Control’s DataAdapter property to assign an adapter to a heatmap. The following adapters are available:
- HeatmapDataSourceAdapter – Allows you to bind the Heatmap Control to a data source.
- HeatmapMatrixAdapter – Allows you to use collections of values to specify x-arguments and y-arguments, and pass a matrix of numeric values to define heatmap cell values.
Examples
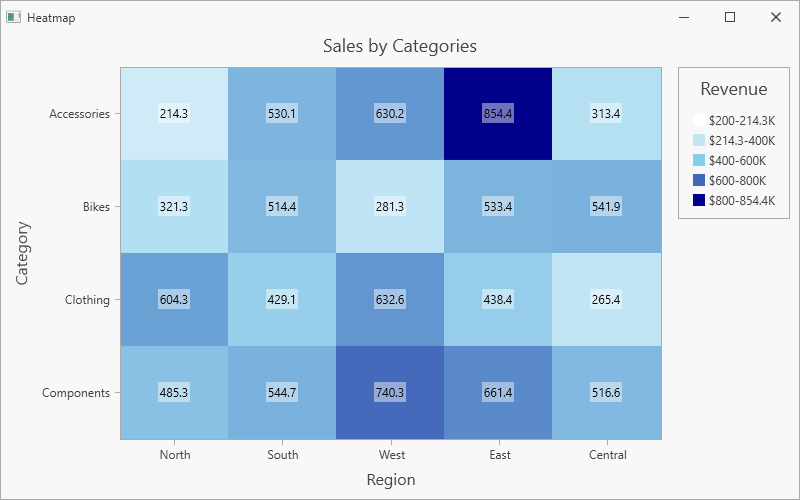
How to Create a Heatmap Based on a Matrix of Numeric Values
This example shows how to use arrays of string and numeric values to create a heatmap.
Follow the steps below to create a heatmap:
Add the HeatmapControl to the project.
Create a HeatmapMatrixAdapter object and assign it to the
HeatmapControl.DataAdapterproperty.Use the adapter’s XArguments and YArguments properties to populate the heatmap with x- and y-arguments that are displayed along x- and y-axes.
Assign a two-dimensional array of double values to the adapter’s Values property.
Create a HeatmapRangeColorProvider object and assign it to the HeatmapControl.ColorProvider property. The Range Color Provider paints cells based on a value range to which the cell value belongs.
Set the HeatmapControl.Legend property to a HeatmapLegend object to display a legend.
Specify the color provider’s HeatmapPaletteColorProvider.LegendItemPattern property to format legend items.
Use the HeatmapControl.AxisX and HeatmapControl.AxisY properties to customize heatmap axes.
To display cell labels, initialize the HeatmapControl.Label property with a HeatmapLabel object.
<dx:ThemedWindow
    xmlns="http://schemas.microsoft.com/winfx/2006/xaml/presentation"
    xmlns:x="http://schemas.microsoft.com/winfx/2006/xaml"
    xmlns:dx="http://schemas.devexpress.com/winfx/2008/xaml/core"
    xmlns:dxh="http://schemas.devexpress.com/winfx/2008/xaml/heatmap"
    xmlns:dxc="http://schemas.devexpress.com/winfx/2008/xaml/charts"
    xmlns:local="clr-namespace:HeatmapMatrixData"
    x:Class="HeatmapMatrixData.MainWindow"
    Title="Heatmap" Height="500" Width="800">
    <Grid>
        <dxh:HeatmapControl>
            <dxh:HeatmapControl.DataContext>
                <local:MatrixHeatmapViewModel/>
            </dxh:HeatmapControl.DataContext>
            <dxh:HeatmapControl.DataAdapter>
                <dxh:HeatmapMatrixAdapter XArguments="{Binding XArguments}"
                                          YArguments="{Binding YArguments}"
                                          Values="{Binding Values}"/>
            </dxh:HeatmapControl.DataAdapter>
            <dxh:HeatmapControl.Titles>
                <dxc:Title Content="Sales by Categories" HorizontalAlignment="Center"/>
            </dxh:HeatmapControl.Titles>
            <dxh:HeatmapControl.ColorProvider>
                <dxh:HeatmapRangeColorProvider ApproximateColors="True"
                                               LegendItemPattern="${V1}-{V2}K">
                    <dxh:HeatmapRangeColorProvider.Palette>
                        <dxc:CustomPalette>
                            <dxc:CustomPalette.Colors>
                                <Color>White</Color>
                                <Color>SkyBlue</Color>
                                <Color>DarkBlue</Color>
                            </dxc:CustomPalette.Colors>
                        </dxc:CustomPalette>
                    </dxh:HeatmapRangeColorProvider.Palette>
                    <dxh:HeatmapRangeColorProvider.RangeStops>
                        <dxh:HeatmapRangeStop Value="0" Type="Percentage"/>
                        <dxh:HeatmapRangeStop Value="200"/>
                        <dxh:HeatmapRangeStop Value="400"/>
                        <dxh:HeatmapRangeStop Value="600"/>
                        <dxh:HeatmapRangeStop Value="800"/>
                        <dxh:HeatmapRangeStop Value="1" Type="Percentage"/>
                    </dxh:HeatmapRangeColorProvider.RangeStops>
                </dxh:HeatmapRangeColorProvider>
            </dxh:HeatmapControl.ColorProvider>
            <dxh:HeatmapControl.Legend>
                <dxh:HeatmapLegend Margin="0, 0, 4, 10">
                    <dxh:HeatmapLegend.Title>
                        <dxc:LegendTitle Content="Revenue"/>
                    </dxh:HeatmapLegend.Title>
                </dxh:HeatmapLegend>
            </dxh:HeatmapControl.Legend>
            <dxh:HeatmapControl.AxisX>
                <dxh:HeatmapAxis>
                    <dxh:HeatmapAxis.Title>
                        <dxc:AxisTitle Content="Region"/>
                    </dxh:HeatmapAxis.Title>
                </dxh:HeatmapAxis>
            </dxh:HeatmapControl.AxisX>
            <dxh:HeatmapControl.AxisY>
                <dxh:HeatmapAxis Reverse="True">
                    <dxh:HeatmapAxis.Title>
                        <dxc:AxisTitle Content="Category"/>
                    </dxh:HeatmapAxis.Title>
                </dxh:HeatmapAxis>
            </dxh:HeatmapControl.AxisY>
            <dxh:HeatmapControl.Label>
                <dxh:HeatmapLabel Foreground="Black"
                                  Background="#70ffffff"
                                  Padding="2"/>
            </dxh:HeatmapControl.Label>
        </dxh:HeatmapControl>
    </Grid>
</dx:ThemedWindow>
using DevExpress.Xpf.Core;

namespace HeatmapMatrixData {
    public partial class MainWindow : ThemedWindow {
        public MainWindow() {
            InitializeComponent();
        }
    }
    public class MatrixHeatmapViewModel {
        public string[] XArguments { get; set; }
        public string[] YArguments { get; set; }
        public double[,] Values { get; set; }
        public MatrixHeatmapViewModel() {
            XArguments = new string[] { "North", "South", "West", "East", "Central" };
            YArguments = new string[] { "Accessories", "Bikes", "Clothing", "Components" };
            Values = new double[,] {
               { 214.3, 530.1, 630.2, 854.4, 313.4 },
               { 321.3, 514.4, 281.3, 533.4, 541.9 },
               { 604.3, 429.1, 632.6, 438.4, 265.4 },
               { 485.3, 544.7, 740.3, 661.4, 516.6 }
            };
        }
    }
}
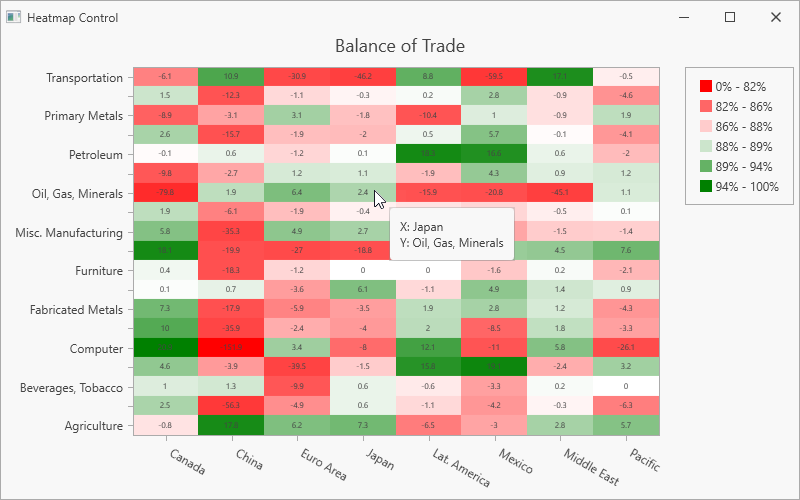
How to Bind a Heatmap to a Data Source (XML File)
The following example shows how to create a heatmap and bind it to a data source. In this example, the heatmap obtains data from an XML file.
Add the HeatmapControl to the project.
Create a HeatmapDataSourceAdapter object and assign it to the
HeatmapControl.DataAdapterproperty.Define the adapter’s DataSource property.
Use the ColorDataMember property to define a data member that is used to determine cell colors.
Specify the following adapter properties to define data members that store heatmap arguments:
Create a HeatmapRangeColorProvider object and assign it to the HeatmapControl.ColorProvider property. The Range Color Provider paints cells based on a value range to which the cell value belongs.
To display cell labels, initialize the HeatmapControl.Label property with a HeatmapLabel object.
Set the HeatmapControl.Legend property to a HeatmapLegend object to add a legend to the heatmap.
Set the HeatmapControl.ToolTipEnabled property to true to enable tooltips. Specify the HeatmapToolTipOptions.Pattern property to define tooltip text display format.
Use the HeatmapControl.AxisX and HeatmapControl.AxisY properties to customize heatmap axes.
In this example, the x-axis AutoGrid property is disabled and GridSpacing is set to 1 to display all axis labels (without gaps). The Angle property defines axis label rotation to avoid overlapped labels.
<dx:ThemedWindow
xmlns="http://schemas.microsoft.com/winfx/2006/xaml/presentation"
xmlns:x="http://schemas.microsoft.com/winfx/2006/xaml"
xmlns:dx="http://schemas.devexpress.com/winfx/2008/xaml/core"
xmlns:dxh="http://schemas.devexpress.com/winfx/2008/xaml/heatmap"
xmlns:dxc="http://schemas.devexpress.com/winfx/2008/xaml/charts"
x:Class="HeatmapDataSource.MainWindow"
Title="Heatmap Control" Height="500" Width="800">
<Grid>
<dxh:HeatmapControl ToolTipEnabled="True">
<dxh:HeatmapControl.ToolTipOptions>
<dxh:HeatmapToolTipOptions Pattern="X: {X}
Y: {Y}" />
</dxh:HeatmapControl.ToolTipOptions>
<dxh:HeatmapControl.Titles>
<dxc:Title Content="Balance of Trade" HorizontalAlignment="Center"/>
</dxh:HeatmapControl.Titles>
<dxh:HeatmapControl.DataAdapter>
<dxh:HeatmapDataSourceAdapter
DataSource="{Binding}"
XArgumentDataMember="Country"
YArgumentDataMember="Product"
ColorDataMember="Value"/>
</dxh:HeatmapControl.DataAdapter>
<dxh:HeatmapControl.ColorProvider>
<dxh:HeatmapRangeColorProvider ApproximateColors="true"
LegendItemPattern="{}{VP1:0%} - {VP2:0%}">
<dxh:HeatmapRangeColorProvider.Palette>
<dxc:CustomPalette>
<dxc:CustomPalette.Colors>
<Color>Red</Color>
<Color>White</Color>
<Color>Green</Color>
</dxc:CustomPalette.Colors>
</dxc:CustomPalette>
</dxh:HeatmapRangeColorProvider.Palette>
<dxh:HeatmapRangeColorProvider.RangeStops>
<dxh:HeatmapRangeStop Value="0" Type="Percentage"/>
<dxh:HeatmapRangeStop Value="-10"/>
<dxh:HeatmapRangeStop Value="-2.5"/>
<dxh:HeatmapRangeStop Value="0"/>
<dxh:HeatmapRangeStop Value="2.5"/>
<dxh:HeatmapRangeStop Value="10"/>
<dxh:HeatmapRangeStop Value="1" Type="Percentage"/>
</dxh:HeatmapRangeColorProvider.RangeStops>
</dxh:HeatmapRangeColorProvider>
</dxh:HeatmapControl.ColorProvider>
<dxh:HeatmapControl.Label>
<dxh:HeatmapLabel FontSize="8"/>
</dxh:HeatmapControl.Label>
<dxh:HeatmapControl.Legend>
<dxh:HeatmapLegend/>
</dxh:HeatmapControl.Legend>
<dxh:HeatmapControl.AxisX>
<dxh:HeatmapAxis AutoGrid="False"
GridSpacing="1">
<dxh:HeatmapAxis.Label>
<dxc:AxisLabel Angle="30"/>
</dxh:HeatmapAxis.Label>
</dxh:HeatmapAxis>
</dxh:HeatmapControl.AxisX>
<dxh:HeatmapControl.AxisY>
<dxh:HeatmapAxis/>
</dxh:HeatmapControl.AxisY>
</dxh:HeatmapControl>
</Grid>
</dx:ThemedWindow>
using DevExpress.Xpf.Core;
using System;
using System.Data;
using System.IO;
using System.Windows;
using System.Xml;
using System.Xml.Linq;

namespace HeatmapDataSource {

    public partial class MainWindow : ThemedWindow {
        public MainWindow() {
            InitializeComponent();
            DataContext = DataLoader.CreateDataSet("/Data/BalanceOfTrade.xml");
        }
    }
    public static class DataLoader {
        static Stream GetStream(string fileName) {
            Uri uri = new Uri(fileName, UriKind.RelativeOrAbsolute);
            return Application.GetResourceStream(uri).Stream;
        }
        public static XDocument LoadXDocumentFromResources(string fileName) {
            try {
                return XDocument.Load(GetStream(fileName));
            } catch {
                return null;
            }
        }
        public static XmlDocument LoadXmlDocumentFromResources(string fileName) {
            XmlDocument document = new XmlDocument();
            try {
                document.Load(GetStream(fileName));
                return document;
            } catch {
                return null;
            }
        }
        public static DataTable CreateDataSet(string fileName) {
            if (!string.IsNullOrWhiteSpace(fileName)) {
                DataSet dataSet = new DataSet();
                dataSet.ReadXml(GetStream(fileName));
                if (dataSet.Tables.Count > 0)
                    return dataSet.Tables[0];
            }
            return null;
        }
    }
}
The XML file structure looks as follows:
<?xml version="1.0" standalone="yes"?>
<BalanceOfTrade xmlns:xsi="http://www.w3.org/2001/XMLSchema-instance" xmlns:xsd="http://www.w3.org/2001/XMLSchema">
  <xs:schema xmlns:xs="http://www.w3.org/2001/XMLSchema">
    <xs:element name="Item">
      <xs:complexType>
        <xs:sequence>
          <xs:element name="Country" type="xs:string"/>
          <xs:element name="Product" type="xs:string"/>
          <xs:element name="Value" type="xs:double"/>
        </xs:sequence>
      </xs:complexType>
    </xs:element>
  </xs:schema>
  <Item>
    <Country>China</Country>
    <Product>Computer</Product>
    <Value>-151.9</Value>
  </Item>
  <Item>
    <Country>China</Country>
    <Product>Oil, Gas, Minerals</Product>
    <Value>1.9</Value>
  </Item>
  <Item>
    <Country>China</Country>
    <Product>Transportation</Product>
    <Value>10.9</Value>
  </Item>
  <Item>
    <Country>China</Country>
    <Product>Apparel</Product>
    <Value>-56.3</Value>
  </Item>
  <!--...-->
</BalanceOfTrade>