DataLabelBase.ShowValue Property
Gets or sets a value indicating whether the data point value should be displayed in a data label.
Namespace: DevExpress.Spreadsheet.Charts
Assembly: DevExpress.Spreadsheet.v26.1.Core.dll
Declaration
Property Value
| Type | Description |
|---|---|
| Boolean | true, to show value labels; otherwise, false. |
Example
The example below demonstrates how to create a clustered column chart and display value labels for all series.
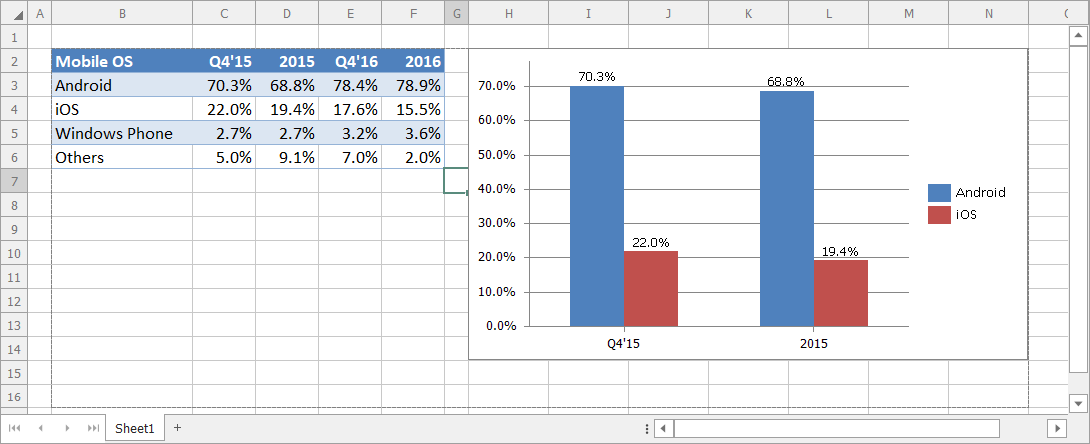
Worksheet worksheet = workbook.Worksheets["chartTask3"];
workbook.Worksheets.ActiveWorksheet = worksheet;

// Create a chart and specify its location.
Chart chart = worksheet.Charts.Add(ChartType.ColumnClustered, worksheet["B2:D4"]);
chart.TopLeftCell = worksheet.Cells["H2"];
chart.BottomRightCell = worksheet.Cells["N14"];

// Show data labels.
chart.Views[0].DataLabels.ShowValue = true;
Related GitHub Examples
The following code snippets (auto-collected from DevExpress Examples) contain references to the ShowValue property.
Note
The algorithm used to collect these code examples remains a work in progress. Accordingly, the links and snippets below may produce inaccurate results. If you encounter an issue with code examples below, please use the feedback form on this page to report the issue.
See Also