IChartSeriesPoint Interface
Defines a point’s appearance settings.
Namespace: DevExpress.Blazor
Assembly: DevExpress.Blazor.v25.2.dll
NuGet Package: DevExpress.Blazor
Declaration
public interface IChartSeriesPointRelated API Members
The following members return IChartSeriesPoint objects:
Remarks
Use the PointAppearance property in a CustomizeSeriesPoint event handler to access and modify the following point settings:
- Color
- Specifies the point’s color.
- Image
- Specifies the point’s image.
- Size
- Specifies the diameter of series points in pixels.
- Symbol
- Specifies a series point’s symbol.
- Visible
- Specifies a series point’s visibility.
Example
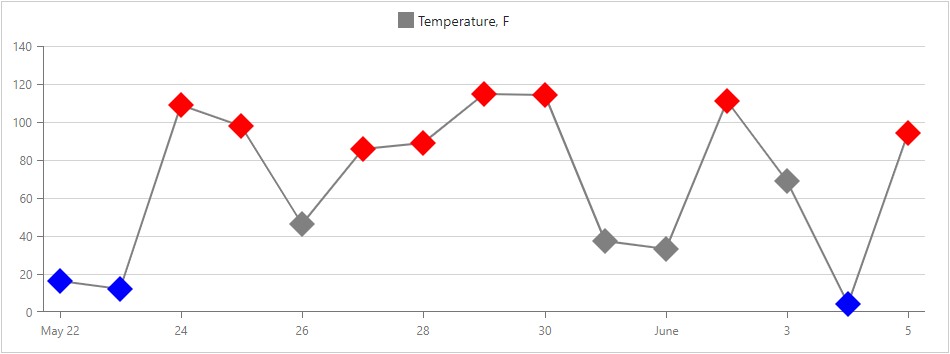
The following code snippet demonstrates how to:
- use the DxChartSeriesPoint component to define the common point appearance;
- handle the CustomizeSeriesPoint event to change the color of points whose values are greater than 75 or less than 25.
<DxChart Data="@WeatherForecasts" CustomizeSeriesPoint="@PreparePointColor">
    <DxChartLineSeries SummaryMethod="@(i => (int)i.Average())"
                       Color="System.Drawing.Color.Gray"
                       ValueField="@((WeatherForecast i) => i.TemperatureF)"
                       ArgumentField="@(i => i.Date.Date)"
                       Name="Temperature, F">
        <DxChartSeriesPoint Symbol="ChartPointSymbol.Polygon"
                            Color="System.Drawing.Color.Gray" Size="25" />
    </DxChartLineSeries>
    <DxChartLegend Position="RelativePosition.Outside" />
</DxChart>

@code {
    WeatherForecast[] WeatherForecasts;
    ...
    protected void PreparePointColor(ChartSeriesPointCustomizationSettings pointSettings) {
        double value = (double)pointSettings.Point.Value;
        if(value > 75)
            pointSettings.PointAppearance.Color = System.Drawing.Color.Red;
        else if(value < 25)
            pointSettings.PointAppearance.Color = System.Drawing.Color.Blue;
    }
}
See Also