2D XY Diagram
- 4 minutes to read
A 2D XY Diagram allows you to visualize data in a Cartesian chart.
The document consists of the following sections:
- Compatible Series Types
- How to: Create a Chart with the 2D XY Diagram
- The Diagram’s Specific Options
Compatible Series Types
You can only add the following compatible series to the 2D XY Diagram:


Refer to the Series Types Compatibility document for more information.
How to: Create a Chart with the 2D XY Diagram
The notation below shows how to create a chart with BarSideBySideSeries2D and LineSeries2D series (the second series is in the separate pane).
<dxc:ChartControl>
    <!-- The XY diagram's settings. -->
    <dxc:XYDiagram2D>
        <!-- The x-axis settings. -->
        <dxc:XYDiagram2D.AxisX>
            <dxc:AxisX2D GridLinesVisible="True"/>
        </dxc:XYDiagram2D.AxisX>
        <!-- The y-axis settings. -->
        <dxc:XYDiagram2D.AxisY>
            <dxc:AxisY2D GridLinesMinorVisible="True"/>
        </dxc:XYDiagram2D.AxisY>
        <dxc:XYDiagram2D.Panes>
            <dxc:Pane x:Name="pane"/>
        </dxc:XYDiagram2D.Panes>
        <!-- The Side-by-Side Bar series settings. -->
        <dxc:BarSideBySideSeries2D DisplayName="Series 1">
            <dxc:BarSideBySideSeries2D.Model>
                <dxc:BorderlessSimpleBar2DModel/>
            </dxc:BarSideBySideSeries2D.Model>
            <dxc:SeriesPoint Argument="A" Value="5"/>
            <dxc:SeriesPoint Argument="B" Value="2"/>
            <dxc:SeriesPoint Argument="C" Value="4"/>
        </dxc:BarSideBySideSeries2D>
        <!-- The Line series settings. -->
        <dxc:LineSeries2D DisplayName="Series 2"
                          dxc:XYDiagram2D.SeriesPane="{Binding ElementName=pane}">
            <dxc:SeriesPoint Argument="A" Value="7"/>
            <dxc:SeriesPoint Argument="B" Value="3"/>
            <dxc:SeriesPoint Argument="C" Value="2"/>
        </dxc:LineSeries2D>
    </dxc:XYDiagram2D>
    <dxc:ChartControl.Legends>
        <dxc:Legend/>
    </dxc:ChartControl.Legends>
    <dxc:ChartControl.Titles>
        <dxc:Title Content="Cartesian Chart"
                   HorizontalAlignment="Center"/>
    </dxc:ChartControl.Titles>
</dxc:ChartControl>
The following table lists the classes and properties that are used in the markup above:
| Class or Property | Description |
|---|---|
| ChartControl | The Chart control. |
| XYDiagram2D | The 2D XY diagram. |
| XYDiagram2D.AxisX | Stores the x-axis’s settings. |
| AxisX2D | A 2D XY Diagram’s x-axis. |
| AxisBase.GridLinesVisible | Specifies the x-axis’s major grid line visibility. |
| XYDiagram2D.AxisY | Stores the y-axis’s settings. |
| AxisY2D | A 2D XY diagram’s y-axis. |
| AxisBase.GridLinesMinorVisible | Specifies the minor y-axis’s grid line visibility. |
| XYDiagram2D.Panes | The chart panes’ collection. |
| Pane | A pane. |
| BarSideBySideSeries2D | The Side-by-Side Bar series. |
| Series.DisplayName | The series’s display name. |
| BarSeries2D.Model | Specifies a series model. |
| BorderlessSimpleBar2DModel | Represents bars without a border. |
| SeriesPoint | A series point. |
| SeriesPoint.Argument | The series point’s argument. |
| SeriesPoint.Value | The series point value. |
| LineSeries2D | The Line series. |
| XYDiagram2D.SeriesPane | Specifies a pane displaying a series. This property is attached property of the XYDiagram2D class. |
| ChartControlBase.Legends | The chart legends’ collection. |
| Legend | A legend. |
| ChartControlBase.Titles | The chart titles’ collection. |
| Title | A title. |
| TitleBase.Content | Specifies title content. |
| TitleBase.HorizontalAlignment | Specifies the title’s horizontal alignment. |
Use the following code to access the 2D XY diagram’s options at runtime:
// Cast Diagram to the XYDiagram2D type.
XYDiagram2D diagram = chart.Diagram as XYDiagram2D;
if (diagram != null) {
    // Access diagram properties, for example, rotate the diagram.
    diagram.Rotated = true;
    // Access properties of objects that belong to the diagram,
    // for example, axes.
    diagram.AxisX.Title = new AxisTitle {
        Content = "Date-Time Scale Type"
    };
}
The Diagram’s Specific Options
The Chart Control provides the following XY Diagram features:
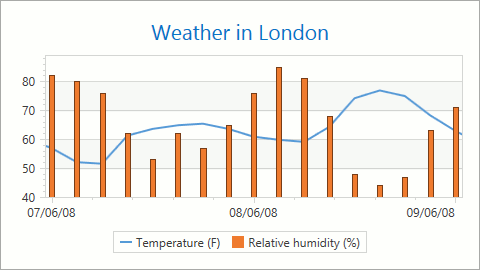
Secondary x- and y-axes. Both primary and secondary axes can contain additional visual elements such as constant lines, axis titles, axis labels, scale breaks and strips.
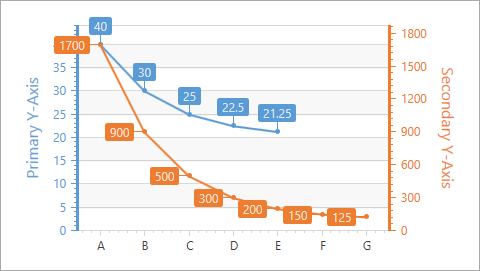
Refer the Secondary Axes help topic for more information.
Multiple panes which can be stacked to each other horizontally or vertically. The 2D XY Diagram contains a single pane by default, which is available using the XYDiagram2D.DefaultPane property. Define Pane objects and add them to the XYDiagram2D.Panes collection to add additional panes.
Refer to Panes to learn more about panes.
Scrolling and zooming capabilities. You can enable scrolling and zooming using the XYDiagram2D.EnableAxisXNavigation and XYDiagram2D.EnableAxisYNavigation properties. Refer to the Zooming and Scrolling (2D XY-Charts) document for more information.

Swap axes using the XYDiagram2D.Rotated property. While a diagram is rotated, an x-axis is oriented vertically and a y-axis horizontally. The transposition does not affect axis functionality.
The property value The resulting image XYDiagram2D.Rotated = false 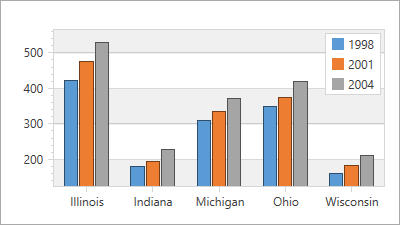
XYDiagram2D.Rotated = true 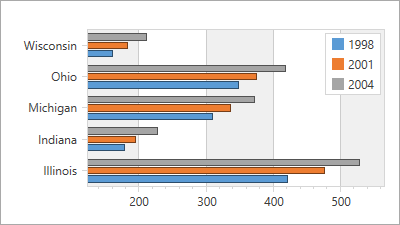
- Customize diagram pane appearance using the Pane.DomainBrush and Background, Foreground properties (inherited from System.Windows.Controls.Control). The Margin property (inherited from System.Windows.FrameworkElement) sets outer spaces between a diagram and other elements within a chart.