This document describes certain limitations that should be taken into account in order to plot series of different view types together onto the same chart control.
You can combine series of different view types within the same chart, if their view types support the same diagram type.
Therefore, it is impossible to plot 2D and 3D series within the same chart. For example, see Pie series together with Bar series: their diagram types are different, so you should use two independent chart controls side-by-side.
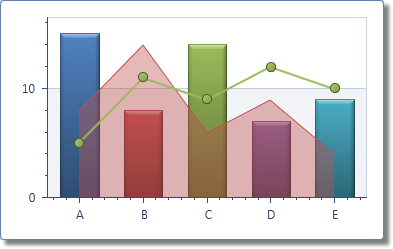
The following image demonstrates a chart that uses the XYDiagram2D type and contains series of different view types.
The following table lists the available diagram types and series view types they support.
| 2D Diagram Type |
Compatible Series View Types |
| SimpleDiagram2D |
Funnel Series, Pie and Donut, Nested Donut |
| XYDiagram2D |
Area, Stacked Area, Full-Stacked Area, Full-Stacked Spline Area,Spline Area,Stacked Spline Area, Step Area, Range Area,Side-by-Side Bar, Side-by-Side Stacked Bar, Side-by-Side Full-Stacked Bar, Stacked Bar, Full-Stacked Bar, Side-by-Side Range Bar, Overlapped Range Bar, Bubble, Line, Spline, Stacked Line, Full-Stacked Line, Step Line, Scatter Line, Point, Stock, Candle Stick,Stacked Step Area,Full-Stacked Step Area |
| RadarDiagram2D |
Radar Area, Radar Line, Scatter Radar Line,Radar Point,Range Radar Area |
| PolarDiagram2D |
Polar Area, Polar Line, Scatter Polar Line,Polar Point,Range Polar Area |
| 3D Diagram Type |
Compatible Series View Types |
| SimpleDiagram3D |
Pie and Donut Series |
| XYDiagram3D |
Area, Stacked Area, Full-Stacked Area, Side-by-Side Bar, Manhattan Bar, Bubble, Point |
For more detailed information on each diagram type, refer to Diagram.