Axes
- 3 minutes to read
The Chart Control uses axes to manage its coordinate space. Axes also contain elements that improve a chart’s readability. The axes’ appearance and functionality depends on the diagram type. For example, the Cartesian chart consists of two perpendicular axes for positioning pairs of arguments and values.
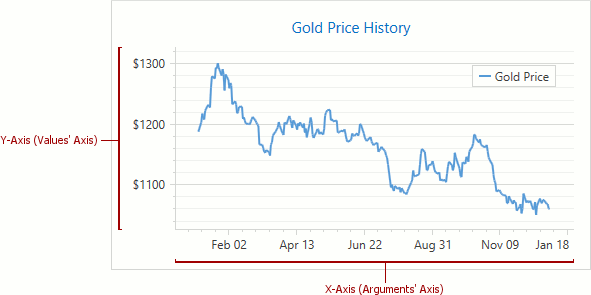
The following image demonstrates primary axes in 2D XY Diagram:
The document consists of the following sections:
Overview
The AxisBase class is the base class for all chart axis types. The AxisBase‘s properties and methods define the functionality that is common to all axes.
The type of arguments’ and values’ axes that are allowed depend on the diagram type. For example, a 2D XY Diagram diagram requires an arguments AxisX2D axis and a values AxisY2D axis; a 2D Polar Diagram requires PolarAxisX2D and PolarAxisY2D.
An axis’s measurement unit depends on the axis’s scale type: Numeric, DateTime, and Qualitative. The Chart control automatically determines an axis’s scale type based on the series’s data. Scale types are available using the Series.ArgumentScaleType and Series.ValueScaleType properties. Refer to Axis Scale Types to learn more about scale types.
Axes allow you to specify ranges the data’s visible ranges. There are two types of ranges - a whole range manages the full data range and a visual range manages the visible data range. Refer to Whole and Visual Ranges for more information.
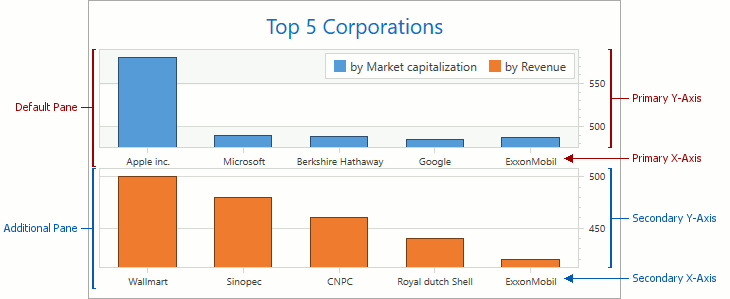
You can add an unlimited number of supplementary (secondary) axes to a 2D XY diagram. Primary and secondary axes behave similarly. Refer to Primary and Secondary Axes to learn how to add a secondary axis to a diagram.
The following image contains a second pane with two secondary axes:
To show or hide a particular axis, set its Axis2D.Visible property. The Axis2D.VisibilityInPanes property also allows limiting axis visibility in certain panes. Refer to the How to: Show or Hide an Axis in a Multi-Pane Chart document to learn how to configure axis visibility across multiple panes.
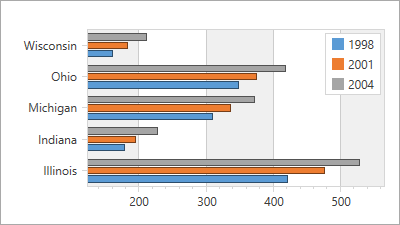
You can rotate a 2D XY diagram and show an x-axis vertically and a y-axis horizontally using the XYDiagram2D.Rotated property. Swapping axes does not affect the axis’s functionality (an x-axis still displays point arguments and a y-axis - point values).
| XYDiagram2D.Rotated = false | XYDiagram2D.Rotated = true |
|---|---|
 |
 |
It is possible to customize axis appearance, for example, modify an axis’s color or its position relative to a diagram. Refer to Axis Layout and Appearance to learn more.
Additional Axis Elements
Each axis can include the following elements:
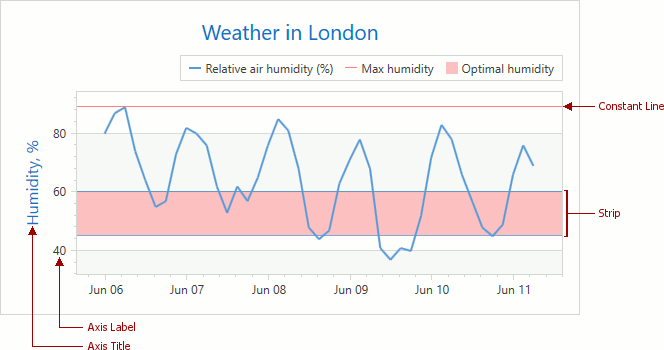
Cartesian axes can also include the following visual indicators:
The following image highlights a constant line, strip, axis title and axis label: