Reporting
- 3 minutes to read
This section contains documentation for DevExpress Reporting, which provides the capability to create reports and reporting applications targeted at the WinForms, ASP.NET and WPF platforms.
-
View and download all available demos related to DevExpress Reporting.
DevExpress Reporting (YouTube)
Browse the DevExpress Reporting playlist to see the available tutorial videos.
Getting Started | |
| This section contains tutorials that describe the main steps used to create a report. |
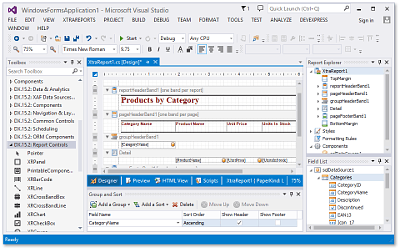
Visual Studio Report Designer | |
| The DevExpress Reporting suite provides a feature-rich report designer to create reports at Visual Studio design time. The created reports are platform-agnostic and can be published later on any of the supported platforms that include WinForms, WPF, ASP.NET and ASP.NET MVC. |
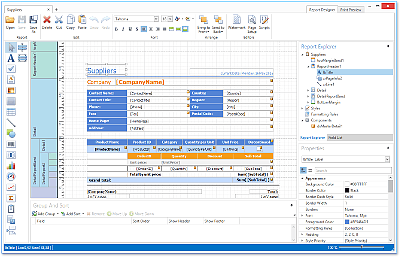
End-User Reporting | |
| The DevExpress Reporting suite provides a fully customizable End-User Report Designer for WPF. You can either integrate it into an existing application, or create a new reporting application from scratch. |
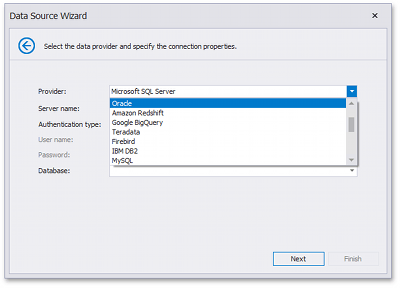
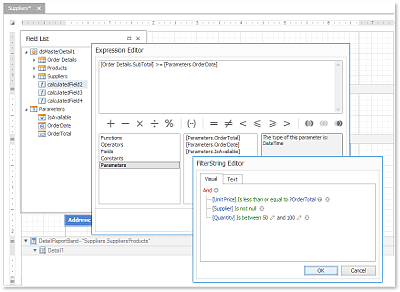
Providing Data | |
| DevExpress Reporting allows you to use various types of data sources to supply the reports with data, such as SQL databases, Entity Framework data sources, custom objects or Excel files. You can also create calculated fields and report parameters that allow you to apply complex expressions to data fields obtained from the report’s data source. |
Report Controls | |
| DevExpress Reporting includes various types of controls that allow you to visualize data in the required way. These elements include various types of charts, the pivot grids, gauges, bar codes, etc. All elements can be bound to a data source in a uniform manner using drag and drop operations. If necessary, you can add interaction between various elements to filter data or visualize data at different detail levels. |
Data Shaping | |
| DevExpress Reports support various data shaping features that include the following.
|
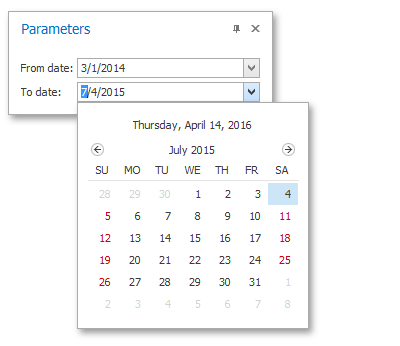
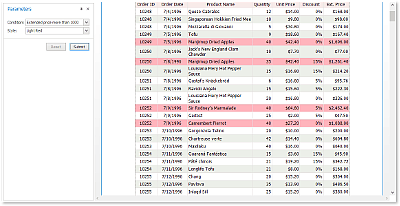
Support for Parameters | |
| To filter data at the level of a data source, use query parameters that can be embedded directly into a SQL string. To filter data in a document, use report parameters of standard (string, Boolean, numeric, date-time, GUID) or custom types. Multi-value and cascading parameters are supported. |
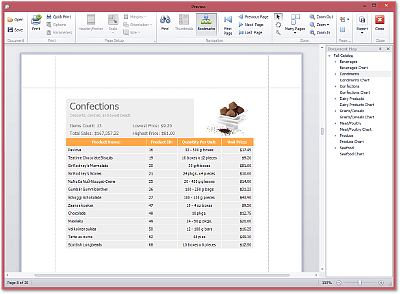
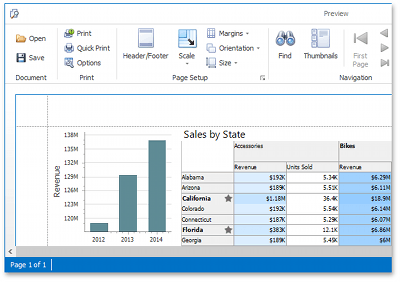
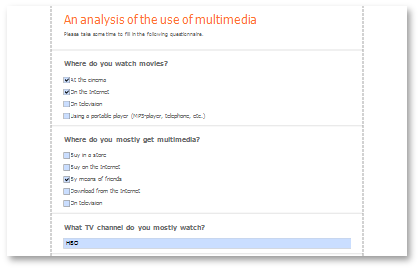
Content Editing in Print Preview | |
| The DevExpress Reporting suite supports interactive document editing in Print Preview. This enables you to customize field values directly in a previewed document before printing or exporting it. You can use standard editors or implement your custom ones, validate the user input as well as format edited values. |
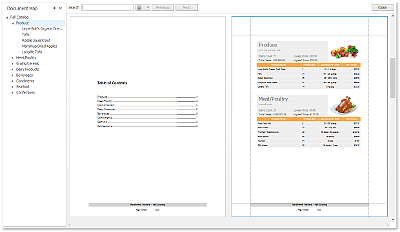
Report Navigation | |
| To switch between different sections in a document, create cross-references or use bookmarks for displaying the document structure in a document map and table of contents. To enable readers to show or hide specific document sections in a Print Preview, enable the drill-down feature by setting a single property. |
Styles and Appearance Settings | |
| Provide uniform appearance settings to report elements by using style sheets. Conditionally change the appearance of any element by using formatting rules. |