Area Series
The Area series are used to show filled areas on a diagram. Values are represented by the height of peaks and hollows in the area of each series point. Values can be either used separately (simple areas) or can be aggregated (stacked and full-stacked areas).
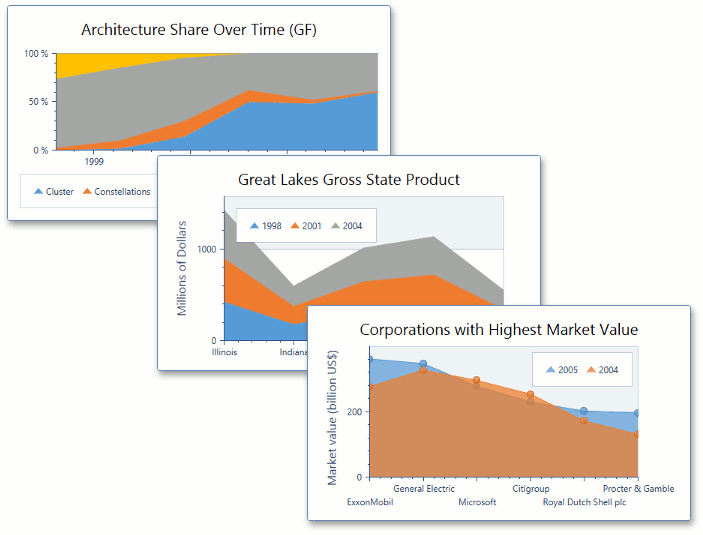
Below is a list of all 2D area charts, which are currently available.
| |
| |
| |
| |
| |
| |
| |
| |
| |
|


To learn about other series types that can be plotted together with Area series, see Series Types Compatibility.