Bubble
Short Description
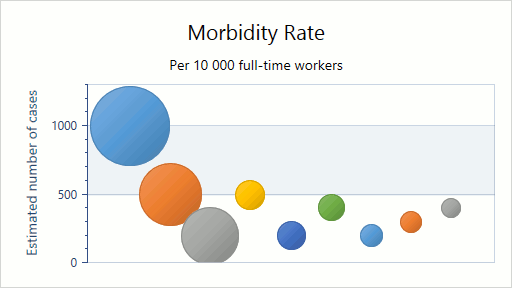
The Bubble series, in addition to Point series capabilities, allows you to visually represent data that has a third dimension, expressed as the bubble’s size. You map two dimensions along the usual X and Y axes, and then the third dimension is displayed as a shape (a filled circle - “bubble”, or a star, triangle, etc.) at the data point.
An example of the Bubble chart is shown in the image below.
Series Characteristics
The table below lists the main characteristics of this chart type.
| Feature | Value |
|---|---|
| Series View type | BubbleSeries2D |
| Diagram type | XYDiagram2D |
| Number of arguments per series point | 1 |
| Number of values per series point | 2 |
For information on which series view types can be combined with the Bubble view, refer to the Series Types Compatibility document.
Example
The following example demonstrates how to create a 2D Bubble chart.