Series and Marker Models
- 2 minutes to read
This document explains how to assign a predefined model or your own custom model to a chart’s series and/or series point markers.
DXCharts ships with numerous predefined models that you can assign to your series and series point markers (if supported). You can also create your own custom series and marker models.
Predefined Models
You can define all models in your Window class descendant’s Resources property, and then assign them to the appropriate series using their Model or MarkerModel properties.
The following series types support the Model property: Bar, Financial and Pie (Donut).
The Area, Point, Line, and Bubble series types implement the ISupportMarker2D interface, which means that you can specify their MarkerModel property.
Note
The Chart Control ships with two types of Series and Marker models: models that draw series or series points via their OnRender method, and models that add each series or series point to the chart’s visual tree. Models that the Chart Control uses by default belong to the first type because the Chart Control renders them faster than via the visual tree.
Refer to How to: Assign Different Models for Series and Point Markers to view a code example.
Custom Models
You can define custom series and marker models by specifying the appropriate custom model (e.g., CustomBar2DModel or CustomMarker2DModel) to the series’ Model or MarkerModel property.
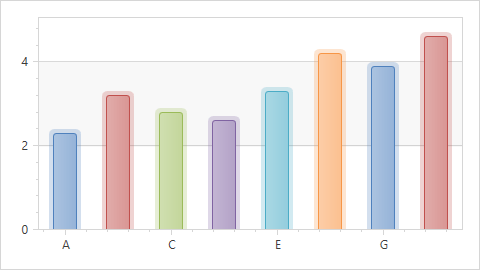
Next, specify the desired appearance changes in a template that contains any visual element, and assign this template to the PointTemplate property of the series custom model (e.g., CustomBar2DModel.PointTemplate).
The following image shows a series with a custom marker model specified.
For details on how to create series custom models, see the How to: Create Custom Series Point Model example.