Stacked Bar
Short Description
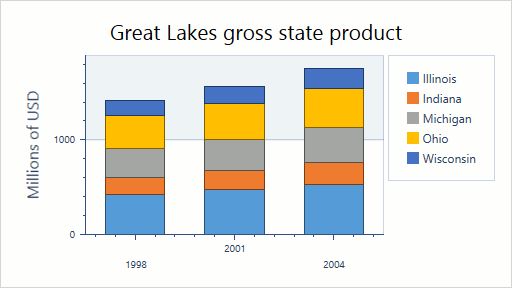
The Stacked Bar series displays data as bars on a diagram, so that the value of each data point is aggregated with the underlying data points’ values. This representation is useful when it’s necessary to compare both the point values and their aggregate for the same point arguments.
An example of the Stacked Bar chart is shown in the image below.
Series Characteristics
The table below lists the main characteristics of this chart type.
| Feature | Value |
|---|---|
| Series View type | BarStackedSeries2D |
| Diagram type | XYDiagram2D |
| Number of arguments per series point | 1 |
| Number of values per series point | 1 |
For information on which series view types can be combined with the Stacked Bar view, refer to the Series Types Compatibility document.
Example
The following example demonstrates how to create a 2D Stacked Bar chart.