Create a Grid & Bind Columns to In-Memory Data
- 4 minutes to read
This tutorial creates a dashboard, adds a grid to the layout, and binds the grid to an in-memory data source.
Create & Configure a RAD Studio Project
Create a new Delphi or C++Builder project and place a TdxDashboardControl component on a form. Set the component’s Align property to alClient in the Object Inspector.
Right-click the TdxDashboardControl component and select the Designer… option[1] to display the Dashboard Designer dialog:
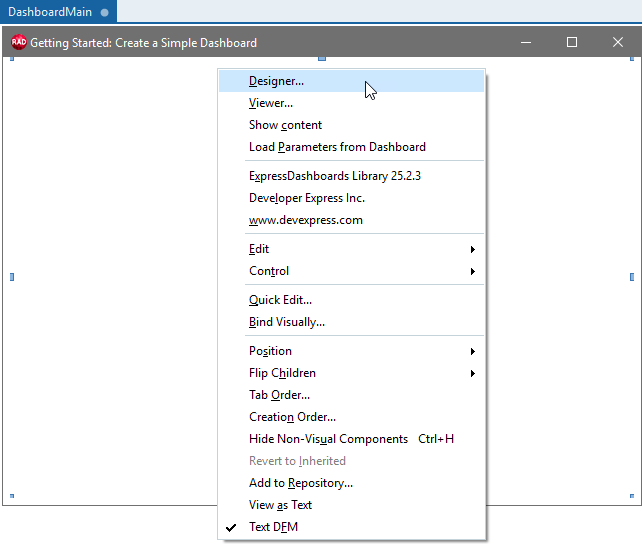
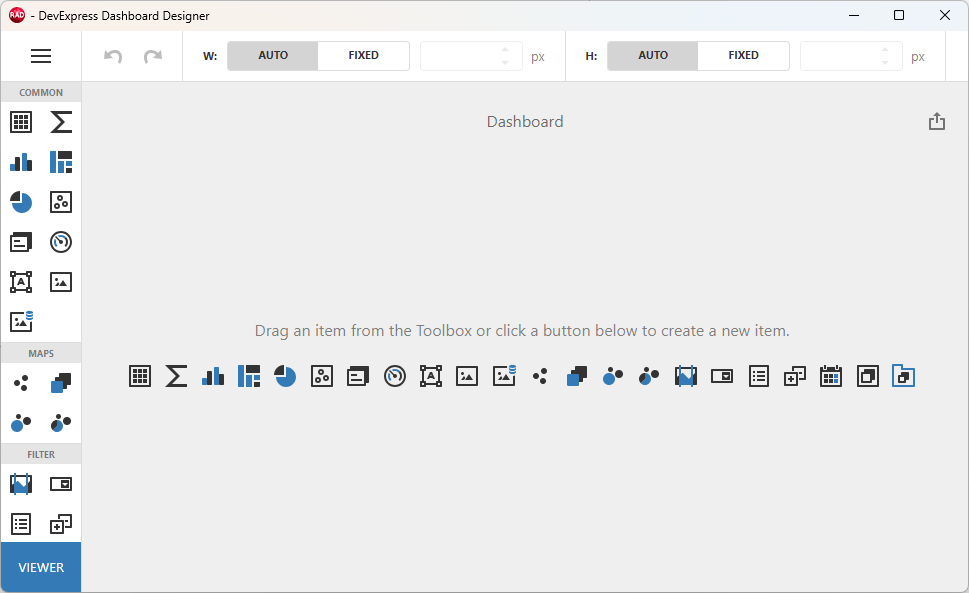
The displayed Dashboard Designer dialog is empty.
Create a Memory-Based Data Source
Click the hamburger button to display the DASHBOARD MENU and select Data Sources.
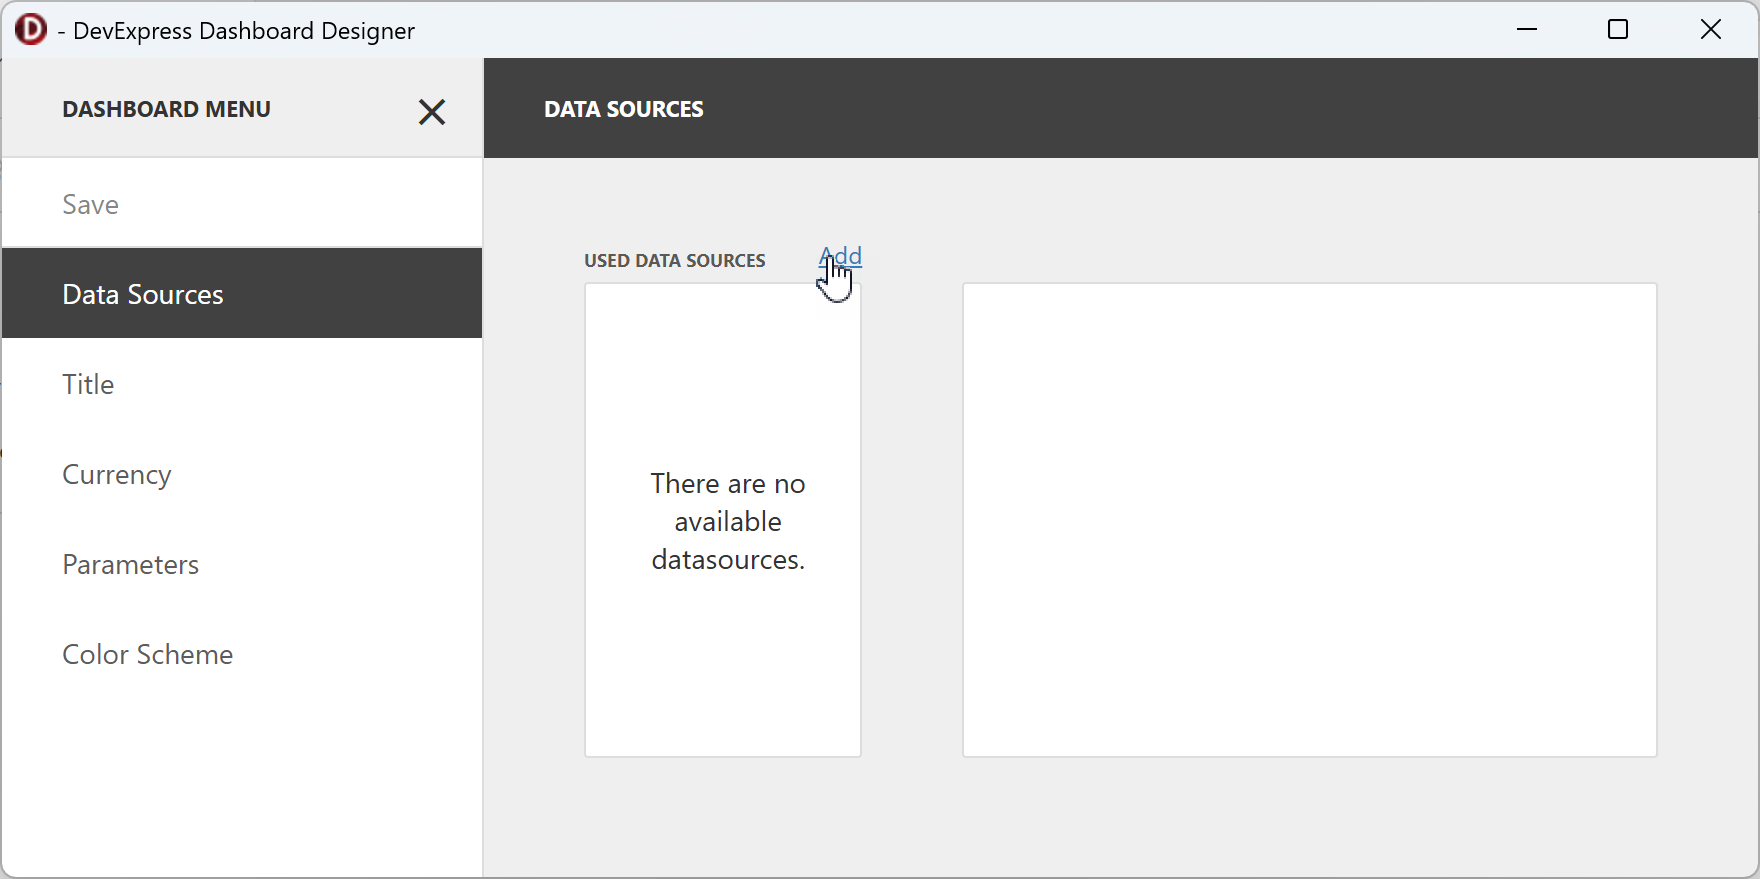
Click Add within the DATA SOURCES pane to display the Add Data Source dialog.
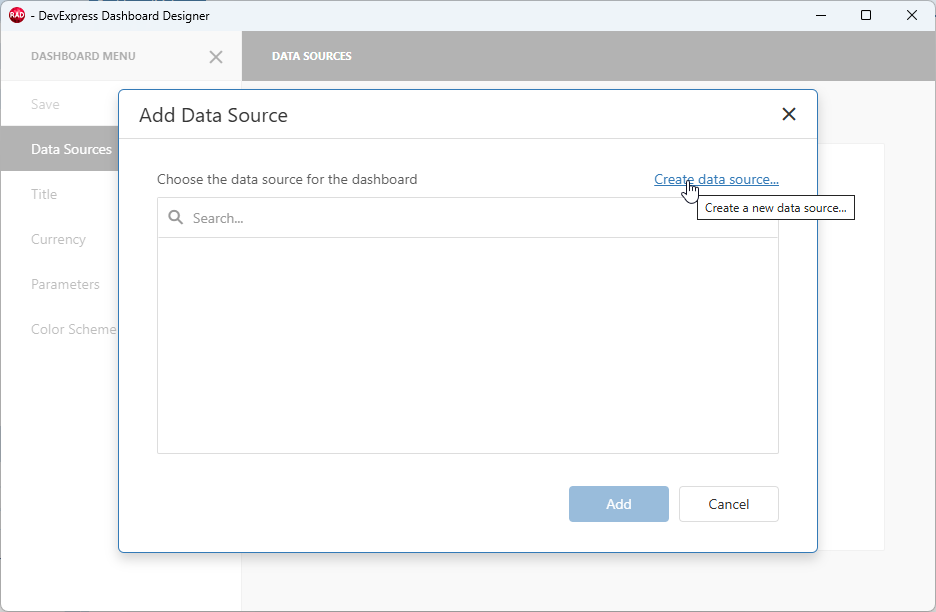
Click Create data source… to display the Dashboard Data Source Wizard dialog:
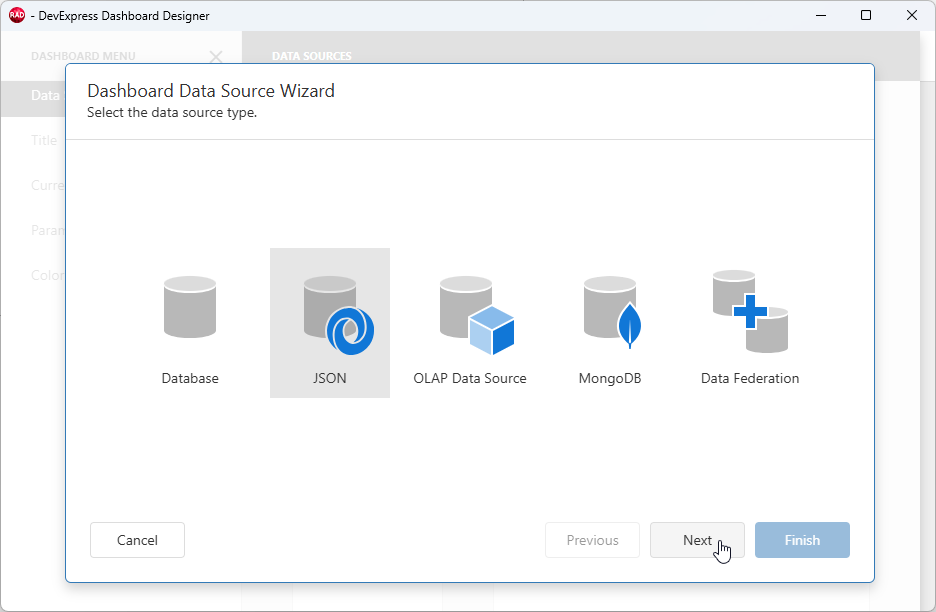
Select JSON and click Next to create a new memory-based data source and choose the following option:
Click the Next button to configure main memory-based connection settings.
Specify JSON Data
Memory-based data sources for ExpressReports and ExpressDashboards support the following options:
- Load JSON data from a remote source using a Web Service Endpoint URL and additional parameters specified within a connection string.
- Load table data from a JSON file.
- Use a specified valid JSON data string (this technique is demonstrated in the current guide).
Step 1 — Copy Source Data
Copy the following JSON string that defines a table with four columns (id, Region, Sales 2024, and Sales 2025) and five rows:
 [{"id": 1, "Region": "Asia", "Sales 2024": 4.7685, "Sales 2025": 4.7685},
  {"id": 2, "Region": "Australia", "Sales 2024": 1.9576, "Sales 2025": 1.9576},
  {"id": 3, "Region": "Europe", "Sales 2024": 3.3579, "Sales 2025": 3.3579},
  {"id": 4, "Region": "North America", "Sales 2024": 3.7477, "Sales 2025": 3.7477},
  {"id": 5, "Region": "South America", "Sales 2024": 1.8237, "Sales 2025": 1.8237}]
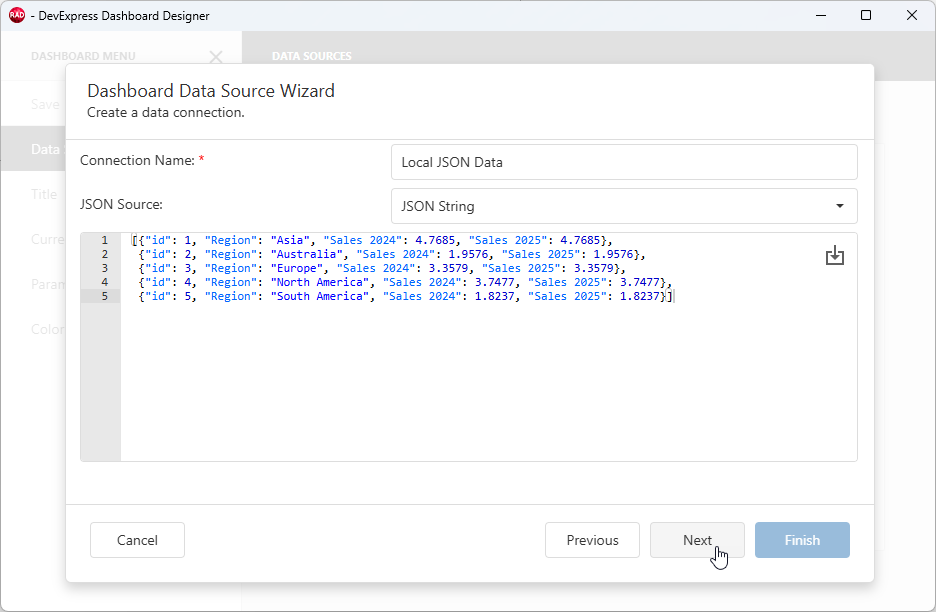
Step 2 — Configure the Created Memory-Based Data Source
- Specify a connection name (Local JSON Data) to identify and access the created data source in the Dashboard Designer dialog.
- Switch the JSON Source combo box to
JSON String. - Paste the previously copied JSON table and click Next.
Step 3 — Select Data Fields & Apply Changes
The next wizard step allows you to select data fields you want to load:
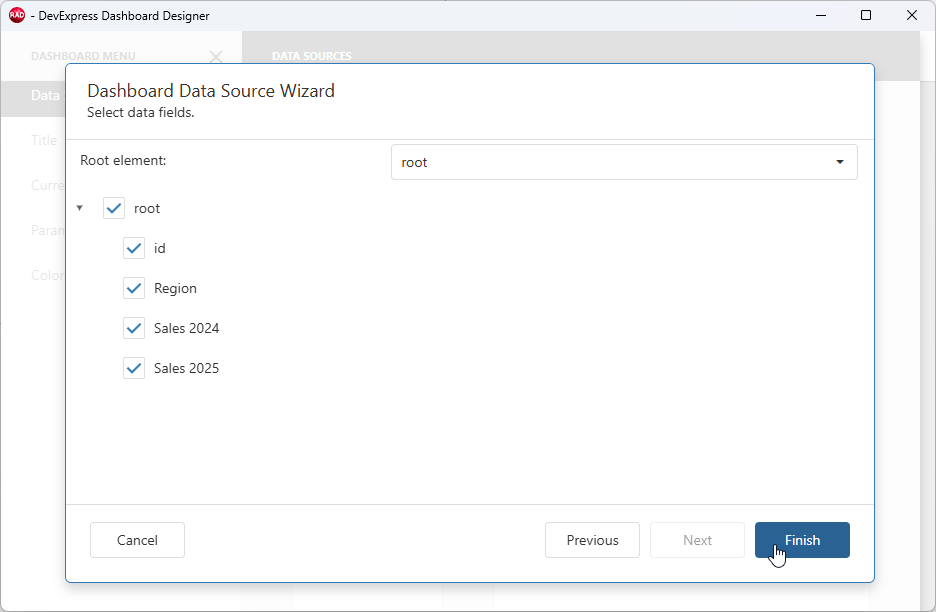
Click Finish to complete data source configuration. The Add Data Source dialog displays the created JSON data source:
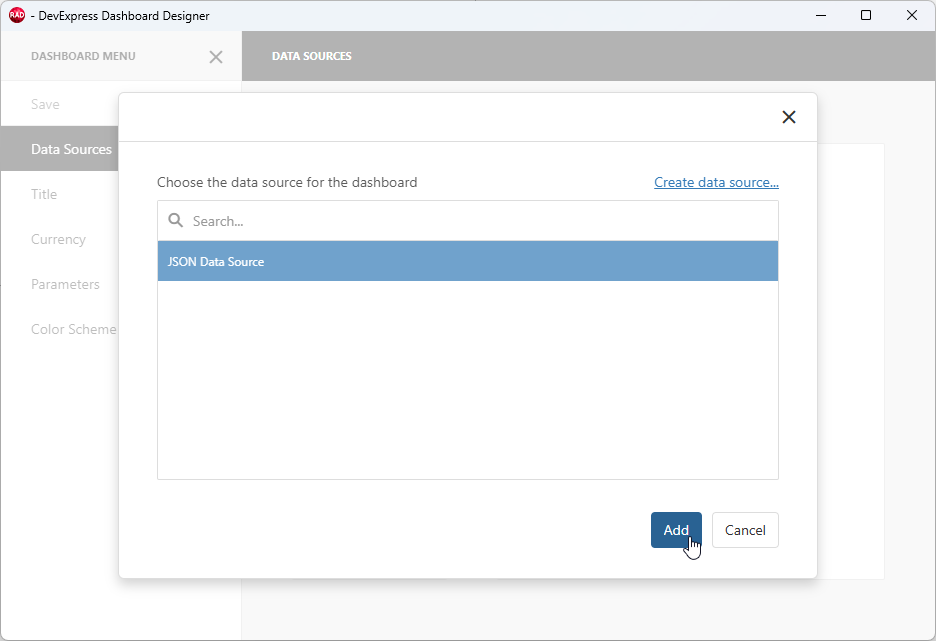
Click Add to publish the created data source (make it available to dashboard items). The DATA SOURCES pane displays loaded fields and corresponding data types for the created data source:
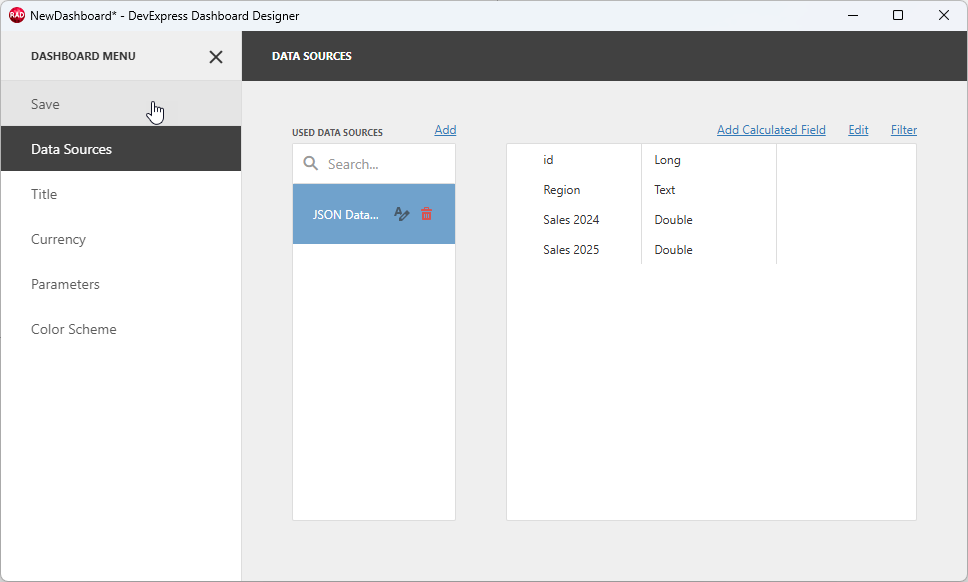
Click Save in the DASHBOARD MENU to save pending data source changes.
Create a Grid and Specify a Data Binding
Click the Grid button within the dashboard area. Alternatively, you can click the same button within the Toolbox panel (the COMMON group):

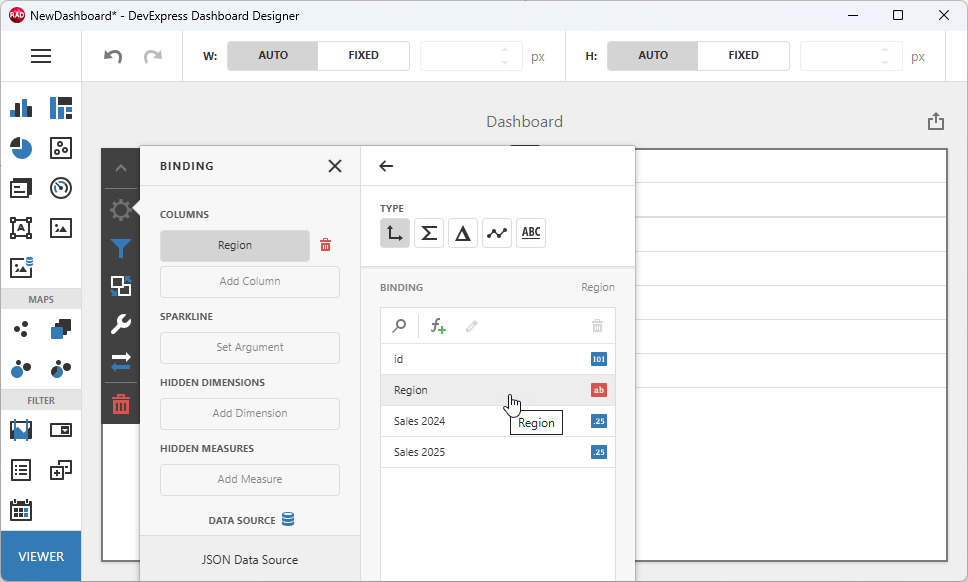
Click within the empty grid area and select the Binding (gear) button to display the corresponding callout designed to create and bind columns to data.
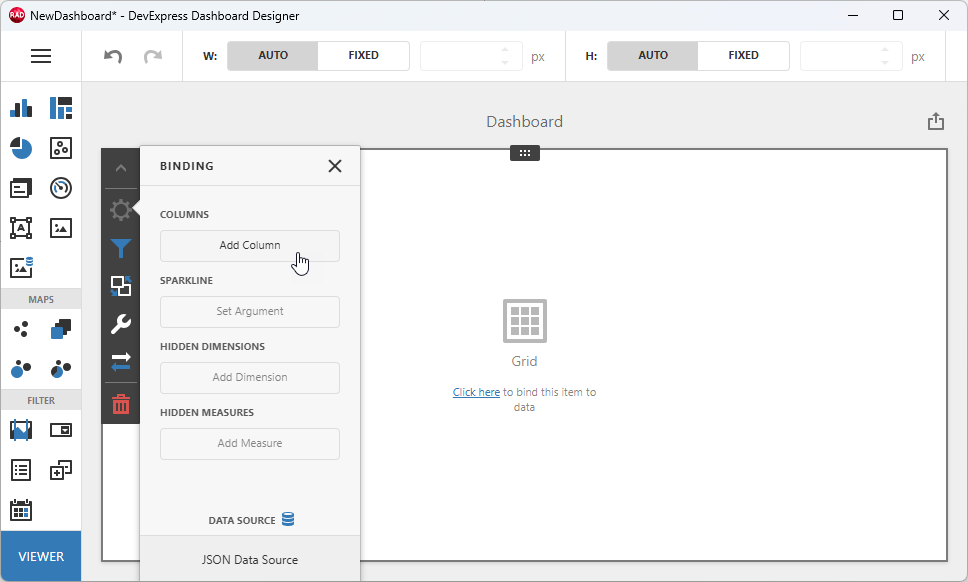
Click Add Column to create a column and display the list of data fields available for binding. Select Region as the target field for the created column.
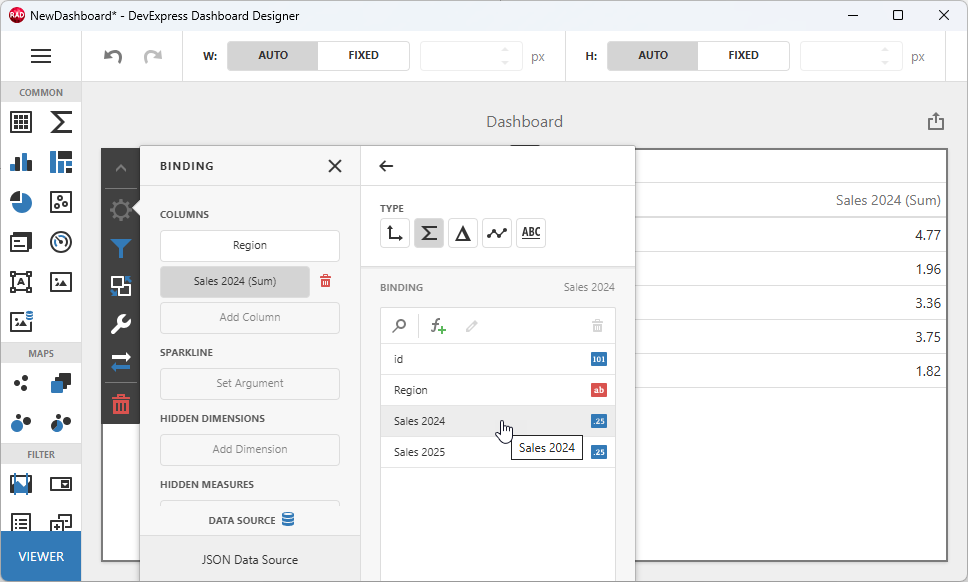
The Grid dashboard item displays the created column. Create another column and bind it to the Sales 2024 field:
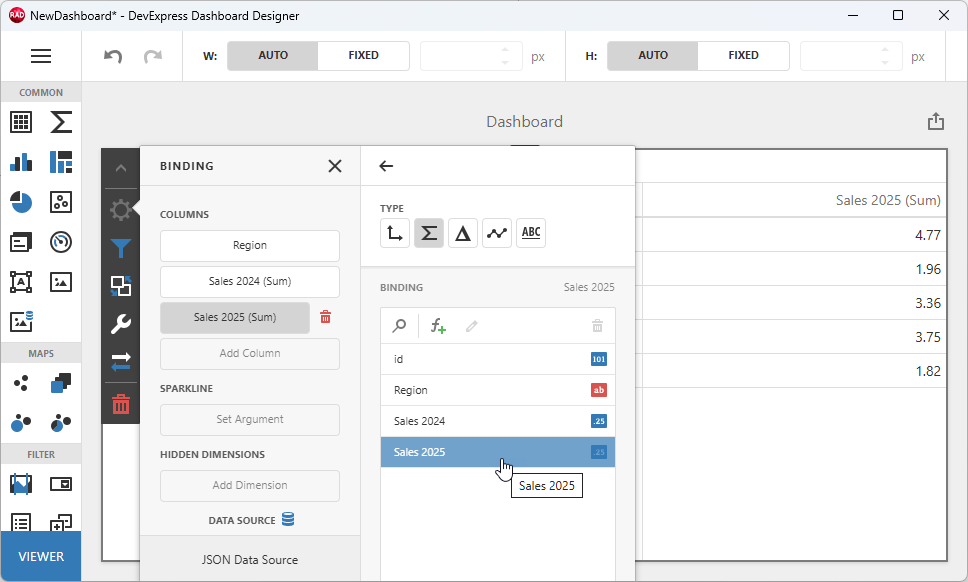
Create an additional column and bind it to the Sales 2025 field:
Click the Options (wrench) button to display the corresponding callout containing general grid settings:
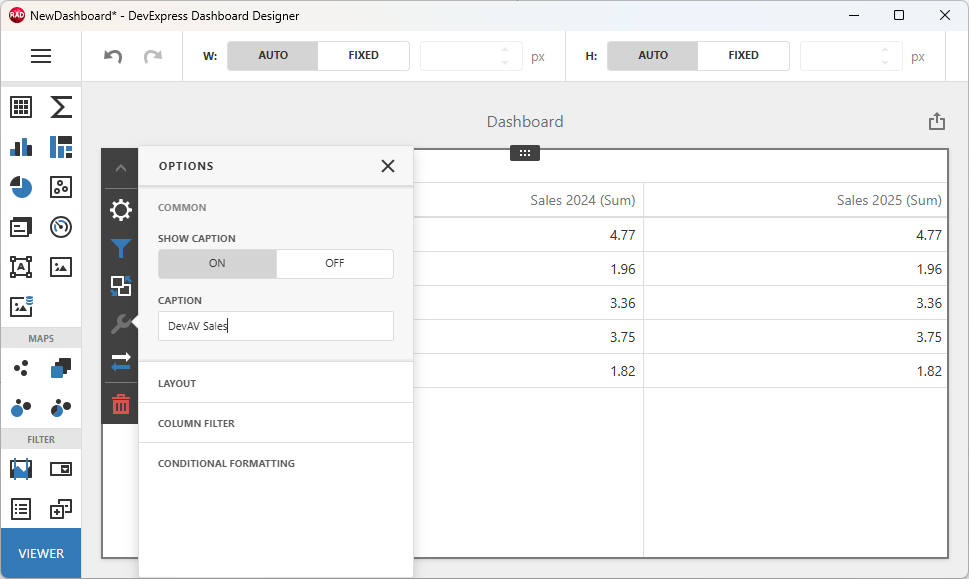
Rename the grid dashboard item and save pending changes in the Dashboard Designer dialog.
Tip
To display data in the TdxDashboardControl component at design time, right-click the component and select the Show Content option.
Build & Run the App
Post-Build Events for WebView2 Loader DLL Deployment
To automatically place a 32 or 64-bit WebView2Loader.dll file into the target build folder, you must:
- Open the Project Options dialog (select the Project → Options… item in the RAD Studio menu or press Ctrl + Shift + F11).
Select Build → Build Events in the tree view pane on the left and select the following option in the Target combo box:
'All Configurations - All Platforms'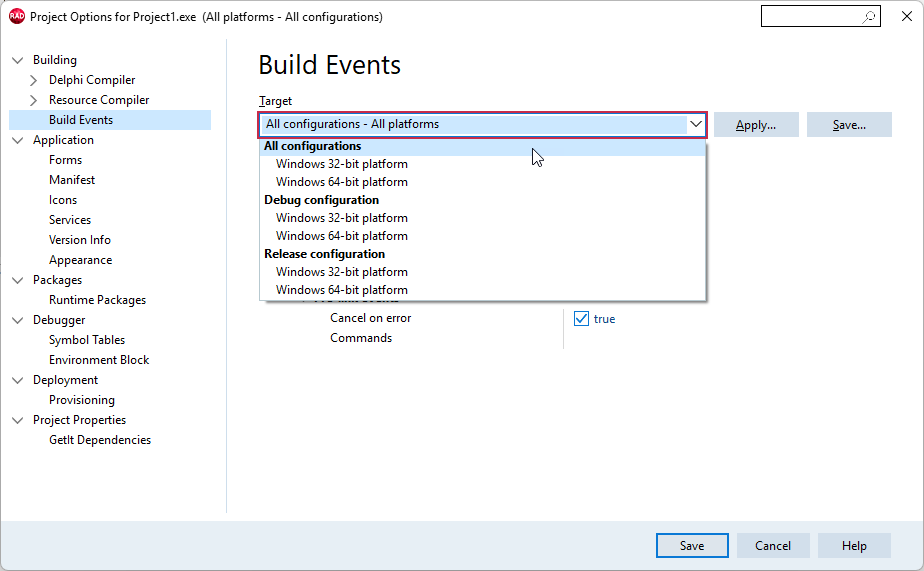
Copy the following command line:
copy /Y "$(BDS)\Redist\$(Platform)\WebView2Loader.dll" $(OUTPUTDIR)Paste the DLL deployment command line into the Commands box:
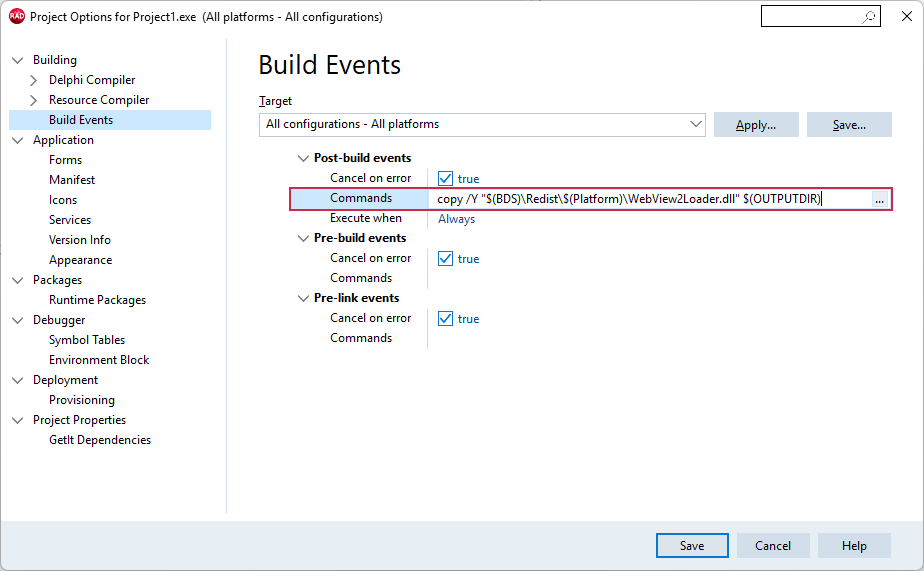
Click the Save button to apply pending changes and close the Project Options dialog.
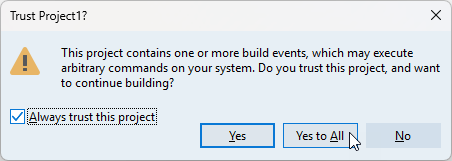
Build the project. Confirm that the configured post-build event is trusted in the following dialog:
All build operations in the current RAD Studio project now ensure that the platform-specific WebView2Loader.dll file version is available in the target build folder (for both Debug and Release configurations).
Run & Test the App
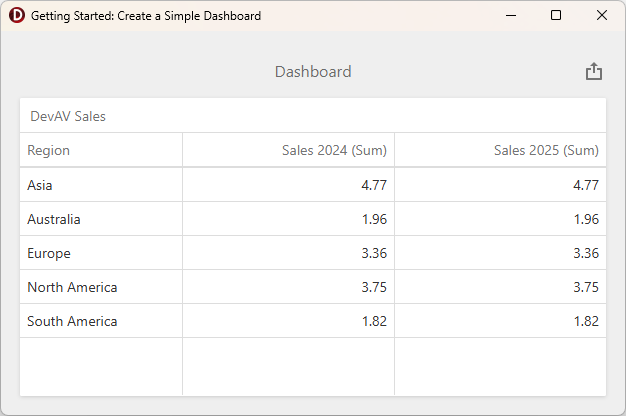
Run the app to view the result:
-
Alternatively, you can double-click the TdxDashboardControl component.