VCL Chart Control
- 3 minutes to read
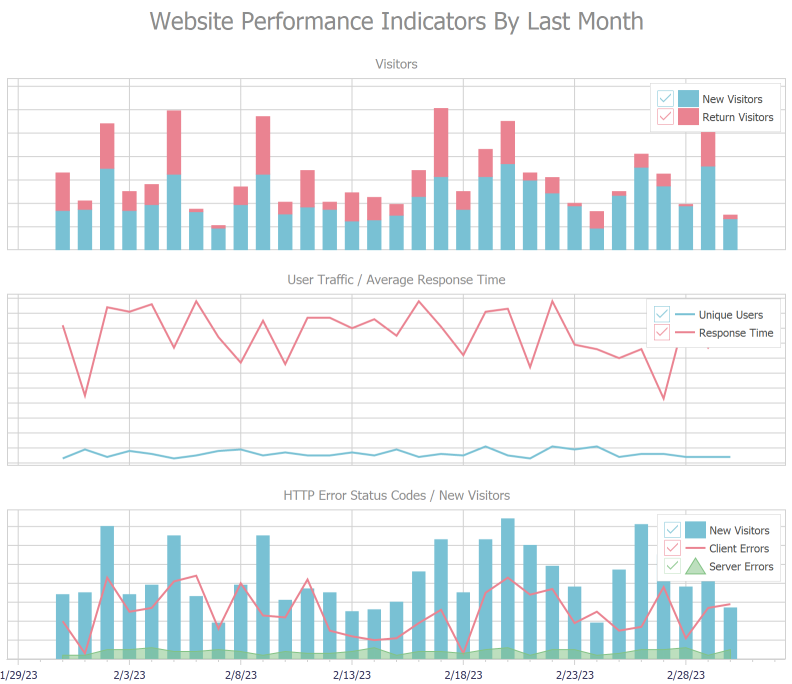
The VCL Chart control (TdxChartControl) allows you to visualize data series in diagrams.
Getting Started
The following tutorials help you get acquainted with the Chart control, and its diagrams and series:
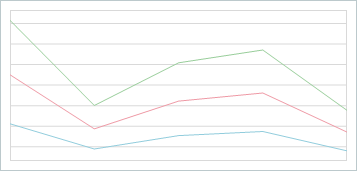
- Line View Tutorial
- This tutorial describes how to create line series, bind them to data, and customize XY diagram appearance at design time.
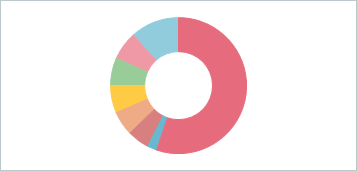
- Doughnut View Tutorial
- This tutorial describes how to create a doughnut series, bind it to data, and customize simple diagram appearance at design time.
Bind to Data
Chart series support the following data access modes:
- Bound
- A chart series loads and visualizes data from a bound dataset. The TDataSource component connects a series to a dataset.
- Unbound
- A chart series is not bound to a dataset. In this mode, you can manually populate series with data points in code.
Supported Render Modes
The Chart control supports all render modes available for DevExpress VCL products:
- DirectX® Render Mode
This render mode uses parallel calculations and utilizes a client machine’s integrated or discrete GPU to render content. The Chart control significantly benefits from this mode if you display multiple diagrams with overlapping series, large numbers of series points, and series labels at different angles in high-DPI environments.
The DirectX® render mode has a number of limitations, such as incompatibility with the GDI Scaled mode. Refer to the mode description for detailed information.
- GDI+ Render Mode
- This render mode is designed for graphics-intense controls that display multiple semitransparent shapes, images, and inscriptions. Use this render mode for the Chart control if DirectX® render mode limitations prevent you from using it in your project.
- GDI Render Mode
- The basic render mode available for all VCL DevExpress controls.
Supported Diagram and Series View Types
The Chart control supports XY and simple diagrams. Every diagram type is compatible with the corresponding set of series Views. You can use the ViewType or ViewClass property of a series to switch between compatible Views on-the-fly.
XY Diagrams
An XY diagram is compatible with XY series that support the following Views:
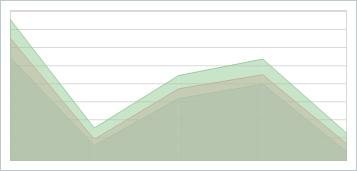
- Area
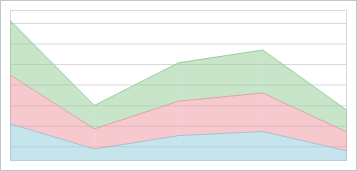
- Stacked Area
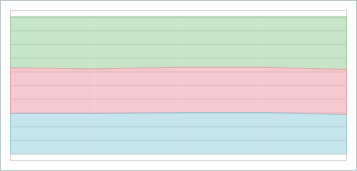
- Full-Stacked Area
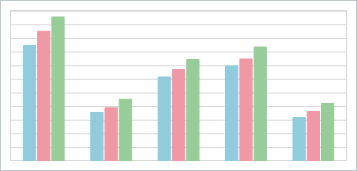
- Bar
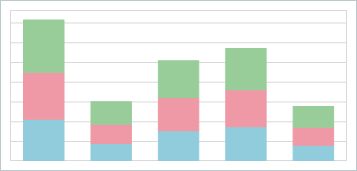
- Stacked Bar
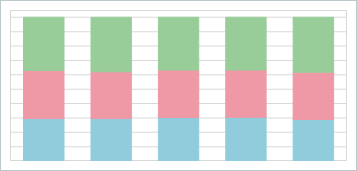
- Full-Stacked Bar
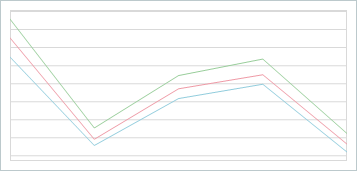
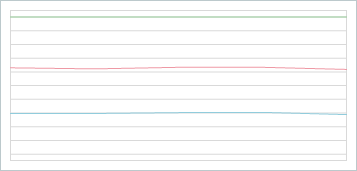
- Line
- Stacked Line
- Full-Stacked Line
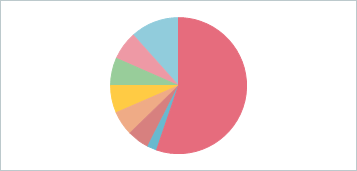
Simple Diagrams
A simple diagram is compatible with simple series that support the following Views:
Visual Chart Elements
The Chart control can display the following visual elements:
- Diagrams
- A diagram is a pane designed to display and manage series.
- Series
- A series is a set of data points displayed in a diagram.
- Series Point Labels
- Series point labels can display values in different formats and include additional information.
- Legends
- A legend is a pane designed to display series captions (for XY diagrams) or series point information (for simple diagrams).
- Axes
- The axis of arguments (X-Axis) and the axis of values (Y-Axis) form a two-dimensional Cartesian coordinate system in an XY diagram. You can customize appearance of axes, add axis captions, and display value labels. Axis settings also allow you to customize the diagram area.
- Titles
- Titles display text not linked to any chart element. Use them to explain chart data.