TdxChartSimpleSeries Class
A series in a simple diagram.
Declaration
TdxChartSimpleSeries = class(
    TdxChartCustomSeries
)
Remarks
Simple series display values as portions of a shape, such as a pie or doughnut. Simple series are useful when you need to compare percentage values of different point arguments in the same series.
Supported Simple Series Views
A series View determines how a simple diagram displays series.[1] A diagram can display multiple series with different Views and individual View appearance settings. You can use the ViewType or ViewClass property to switch between compatible Views in any existing series and display the same data in a different manner at any time.
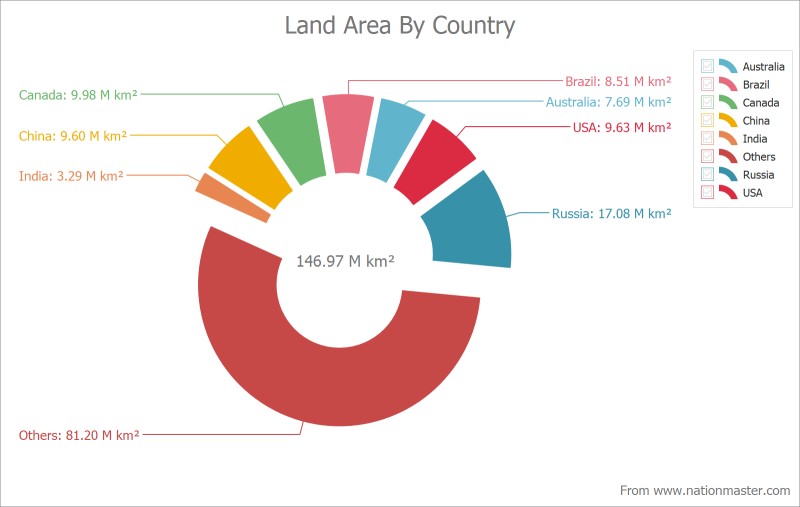
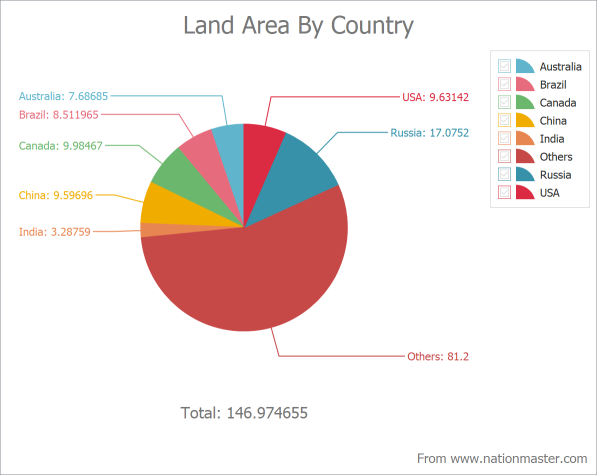
Pie View
The Pie View displays series values as slices of a circle whose radial angles reflect shares of all series values in relation to their total.
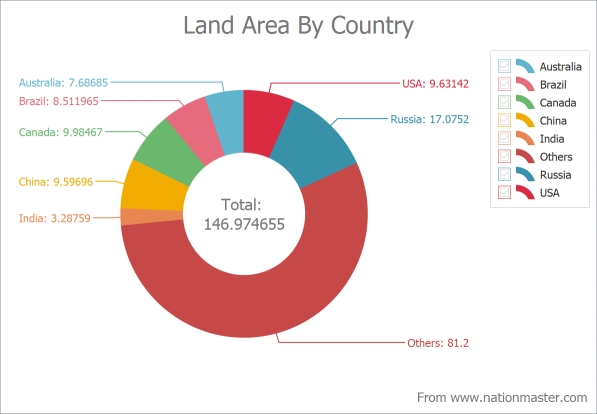
Doughnut View
The Doughnut View is identical to the Pie View but has a hole in its center.
Main API Members
The list below outlines key members of the TdxChartSimpleSeries class that allow you to configure series.
- Specify the series caption and title (Caption and Title).
- Switch between data access modes (DataBindingClass and DataBindingType).
- Configure the connection between the series and its data source in any data access mode (DataBinding).
- Move the series between simple diagrams (Diagram).
- Determine how the Chart control displays empty data points in the series (EmptyPointsDisplayMode).
- Sort data points by values or arguments in ascending or descending order (SortBy and SortOrder).
- Move the series within its diagram (Index).
- Access and manage series points (Points).
- Specify the custom name for saving series points to a stream (StoredName).
- Copy settings between simple series (AssignFrom).
- Avoid excessive redraw operations during batch data and appearance changes (BeginUpdate, CancelUpdate, and EndUpdate).
- Switch between available View types (ViewClass and ViewType).
- Customize appearance settings for the selected series View (View).
Example
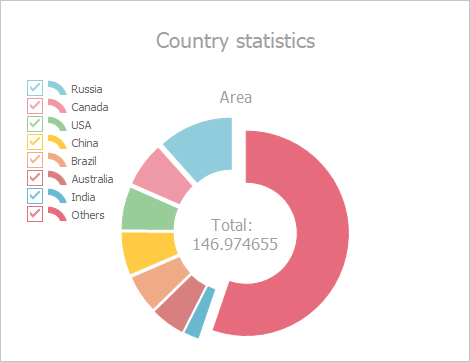
The following code example creates a simple series with the Doughnut View and populates it with data points in unbound mode:
var
  ASimpleDiagram: TdxChartSimpleDiagram;
  ASimpleSeries: TdxChartSimpleSeries;
  ADoughnutView: TdxChartSimpleSeriesDoughnutView;
begin
  dxChartControl1.BeginUpdate;  // Initiates the following batch change
  try
    ASimpleDiagram := dxChartControl1.AddDiagram<TdxChartSimpleDiagram>('Country statistics');
    ASimpleDiagram.Title.Appearance.FontOptions.Size := 16;
    ASimpleDiagram.Legend.AlignmentHorz := TdxChartLegendAlignment.Near; // Moves the legend pane
    ASimpleSeries := ASimpleDiagram.AddSeries('Area');  // Creates a simple series
    // Displays series data point arguments on the diagram legend pane
    ASimpleSeries.ShowInLegend := TdxChartSeriesShowInLegend.Diagram;
    ASimpleSeries.ViewType := 'Doughnut';  // Selects the Doughnut series View
    ASimpleSeries.DataBindingType := 'Unbound';  // Selects the unbound data access mode
    TdxChartSimpleSeriesUnboundDataBinding(ASimpleSeries.DataBinding).ArgumentField.ValueType := 'string';
    ASimpleSeries.Title.Text := 'Area';  // Specifies the series title
    // Populates the unbound simple series with data points
    ASimpleSeries.Points.Add('Russia', 17.0752);
    ASimpleSeries.Points.Add('Canada', 9.98467);
    ASimpleSeries.Points.Add('USA', 9.63142);
    ASimpleSeries.Points.Add('China', 9.59696);
    ASimpleSeries.Points.Add('Brazil', 8.511965);
    ASimpleSeries.Points.Add('Australia', 7.68685);
    ASimpleSeries.Points.Add('India', 3.28759);
    ASimpleSeries.Points.Add('Others', 81.2);
    // Customizes appearance of the Doughnut series View
    ADoughnutView := ASimpleSeries.View as TdxChartSimpleSeriesDoughnutView;
    ADoughnutView.HoleRadius := 50;
    ADoughnutView.ExplodedValueOptions.Mode := TdxChartExplodedValueMode.All;
  finally
    dxChartControl1.EndUpdate;  // Calls EndUpdate regardless of the batch operation's success
  end;
Direct TdxChartSimpleSeries Class References
A simple diagram’s Series and VisibleSeries properties reference a TdxChartSimpleSeries object.